
Line Chart Widget Overview
This tutorial describes the scope of the Line Chart widget features and gives all the necessary guidelines about how to create and add a good-looking line chart to your website’s page using the JetElements plugin.
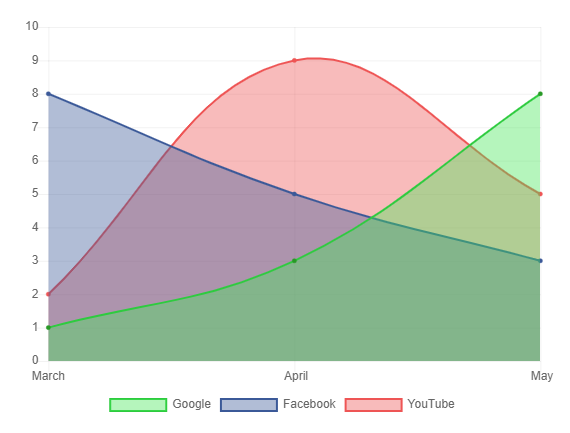
A line chart is one of the most understandable ways of displaying information. And if the chart also looks attractive, it will be a great decoration on the page. JetElements plugin includes a widget that allows you to create an eye-catching line chart and then place it on any part of your website. Let’s go through all Line Chart widget features and create one step by step.
1 Step — Enable the widget and add it to the page
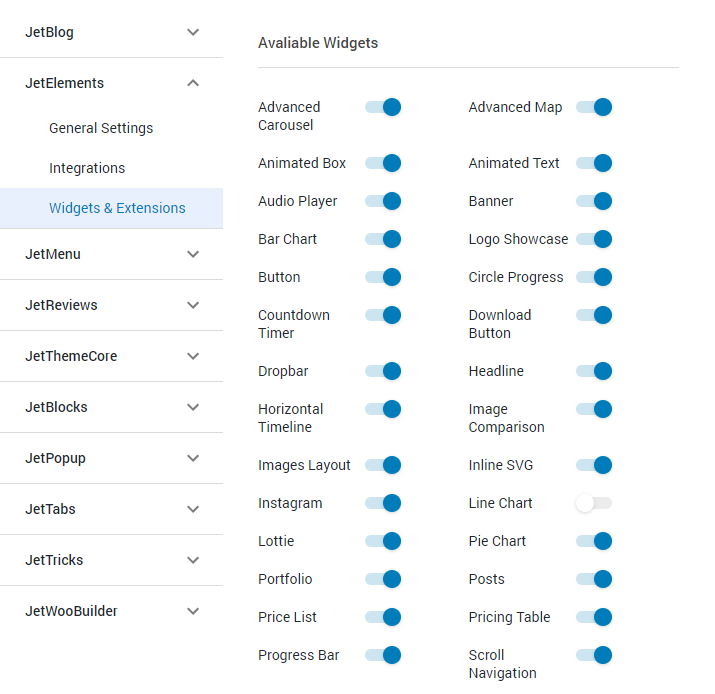
Open your website’s dashboard and proceed to Crocoblock > JetPlugins Settings > JetElements > Widgets & Extensions. Find the “Line Chart” switcher in the list and enable it.
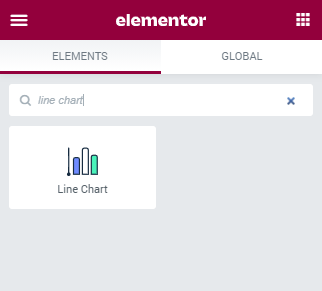
Go to the page or post where you would like to place the line chart and open it in the Elementor page builder. In the left-side menu, find the Line Chart widget and drag it to the page.
2 Step — Add the cart data
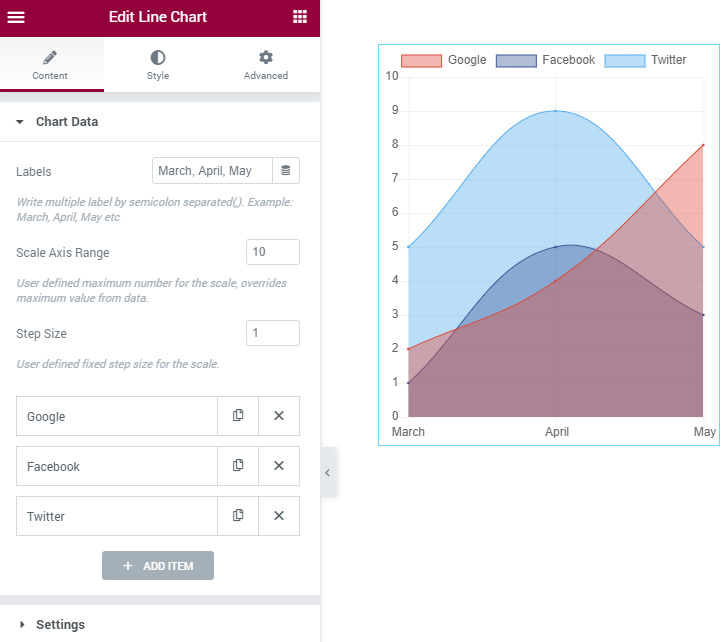
After adding the widget to the page, you will see a default look of the chart. To change the demo data and customize the chart according to your needs, go to the left-side menu and open the Content > Chart Data.
Let’s explore the features.
- Labels. In this field, you put the titles of the x-axis points. Separate them with commas;
- Scale Axis Range. Here you can define the maximum value of the y-axis scale. If the data you use for data lines have a value bigger than the maximum of the scale, the chart will go over the border and won’t be seen;
- Step Size. The number you place into this field defines the distance between y-axis points and the number of points on the axis. For example, if the Scale Axis Range is set to 100 and you will choose the Step Size of 20, there will be five points on the axis.
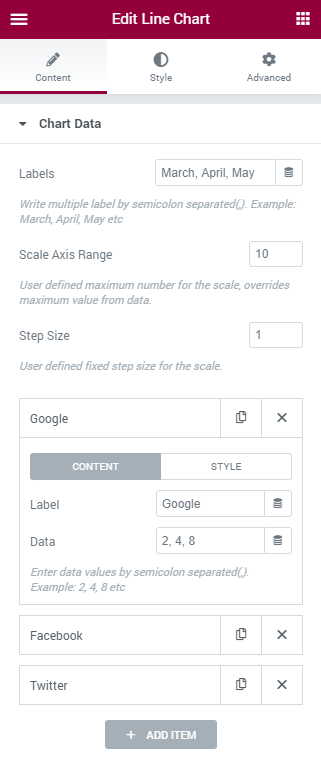
Each data line you want to show in the chart is represented by an item in the Chart Data section. You can add as many items as you need by clicking the “Add Item” button or delete all but one. Every item has two tabs:
- Content. In the Label field, you choose the name of the data line. As to the values of the y-axis, you should place them into the Data field. Be aware that the number of values has to match the number of labels you put into the Labels field. All additional values won’t be visible in the chart;
- Style. In this tab, you can choose the colors for Points, Border, and the Background.
1 Step — Define the settings
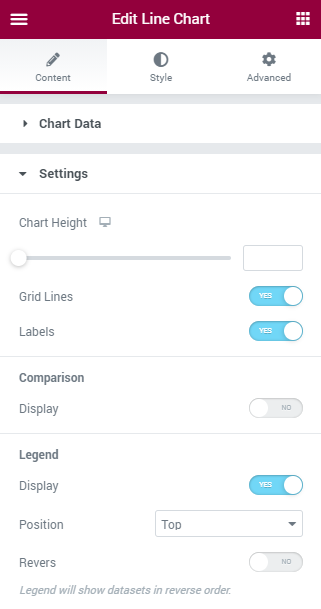
Now it is time to proceed to the Settings section of the Content menu tab. Here you can set the general chart’s features.
- Chart Height. By default, the chart has the height of the section you place it into. However, you can change it by moving this slider or inserting the height in pixels;
- Grid Lines and Labels. Those toggles make the grid lines and axis labels visible. If you prefer the minimalistic design, you can turn them off, and the user will see only the data lines;
- Comparison Display. By enabling this toggle, you add the comparison to the tooltips. The previous value will be shown near the current one in the tooltip that emerges on hover. You can also choose to show labels or some custom data;
- Legend Display. Here you can define whether you want to show the legend or not. Besides that, you can define the legend’s Position or choose to display the datasets in reversed order.
When you finish customization, proceed to the Style menu tab and change the appearance of your line chart according to your taste. Finally, click the “Update” green button at the bottom of the menu to save the changes.
That’s all. You now know how to create the line chart and add it to the website. Build as many charts as you need. Good luck!