Dynamic Charts Builder Overview
This overview will describe the general settings of Dynamic Charts and how to create and customize them.
From this tutorial, one can find out everything about Dynamic Charts functionality from the JetEngine plugin. With Dynamic Charts, the data can be loaded dynamically from the previously created query and displayed in charts, such as “Bar,” “Line,” “Pie,” “Geo,” “Histogram,” and many others.
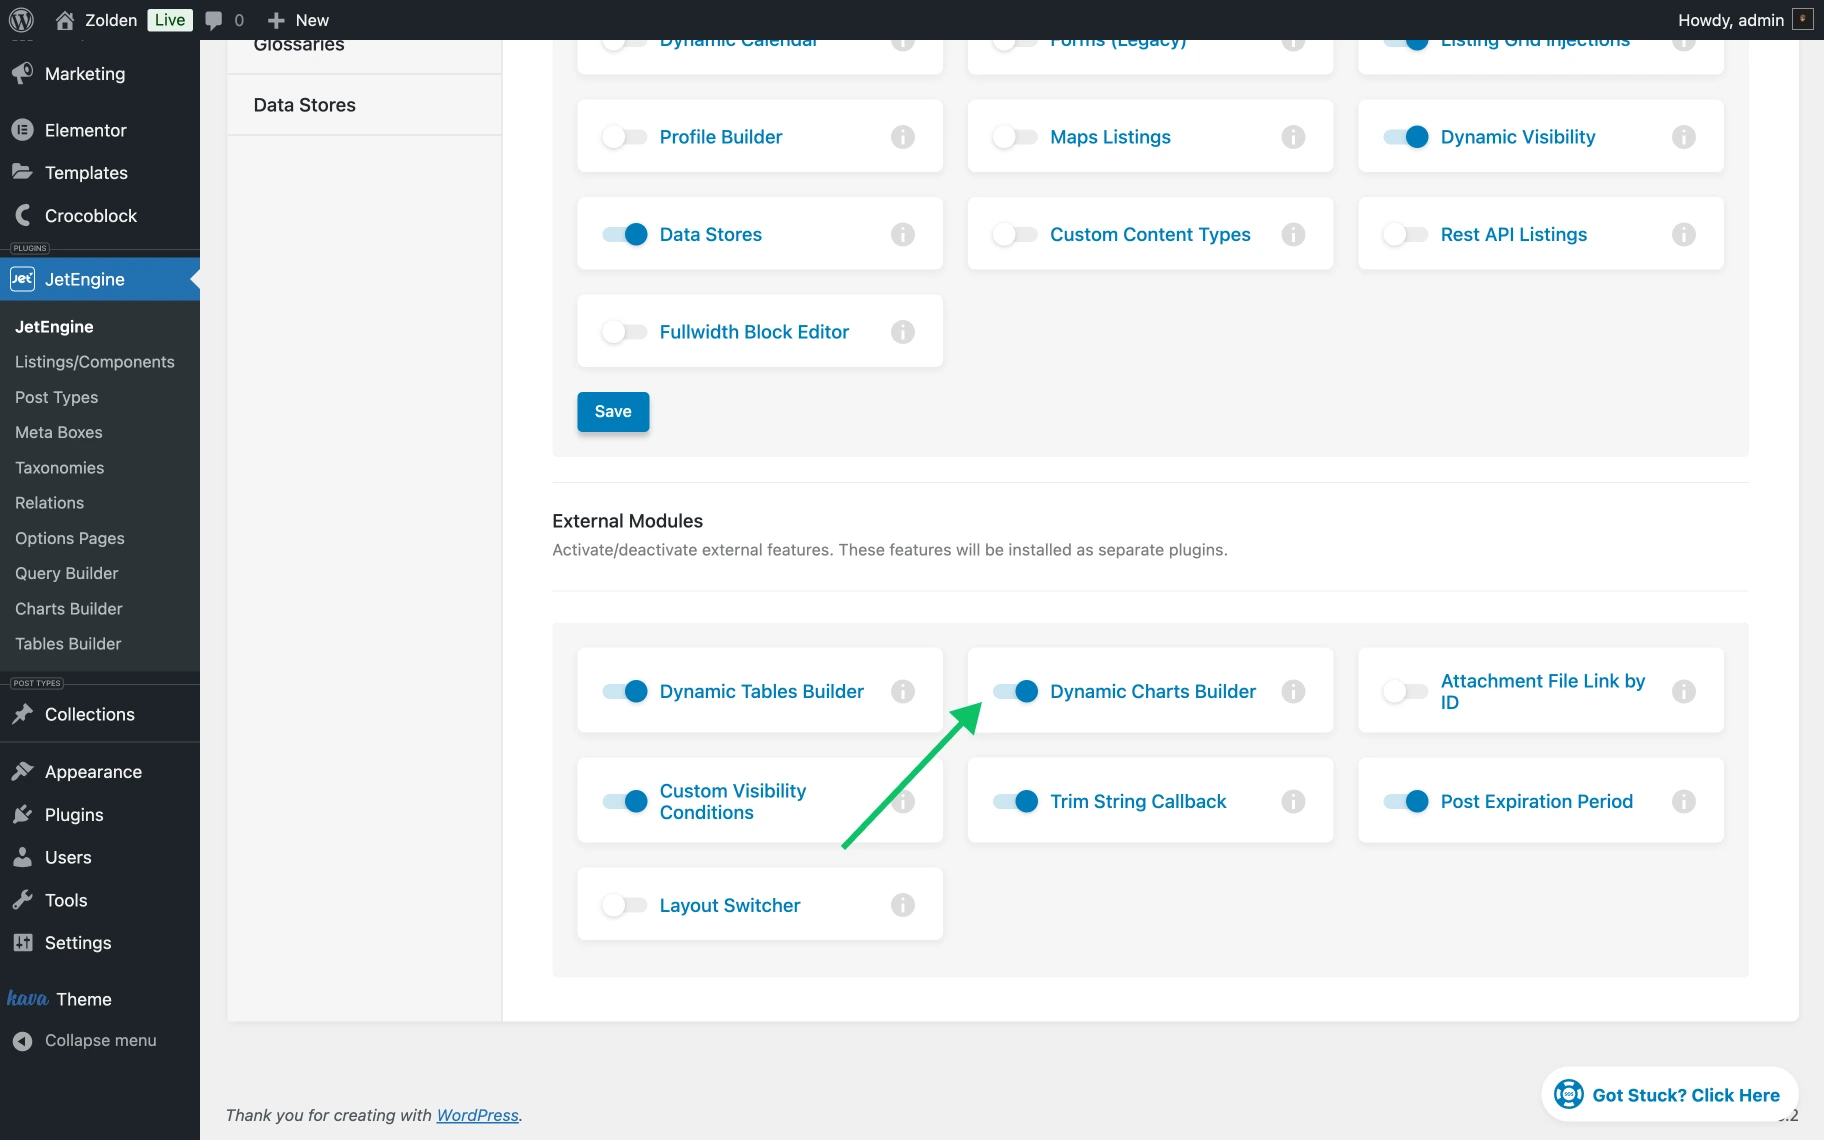
The path to enable the Dynamic Charts Builder module is WordPress Dashboard > JetEngine > JetEngine > Modules > External Modules.
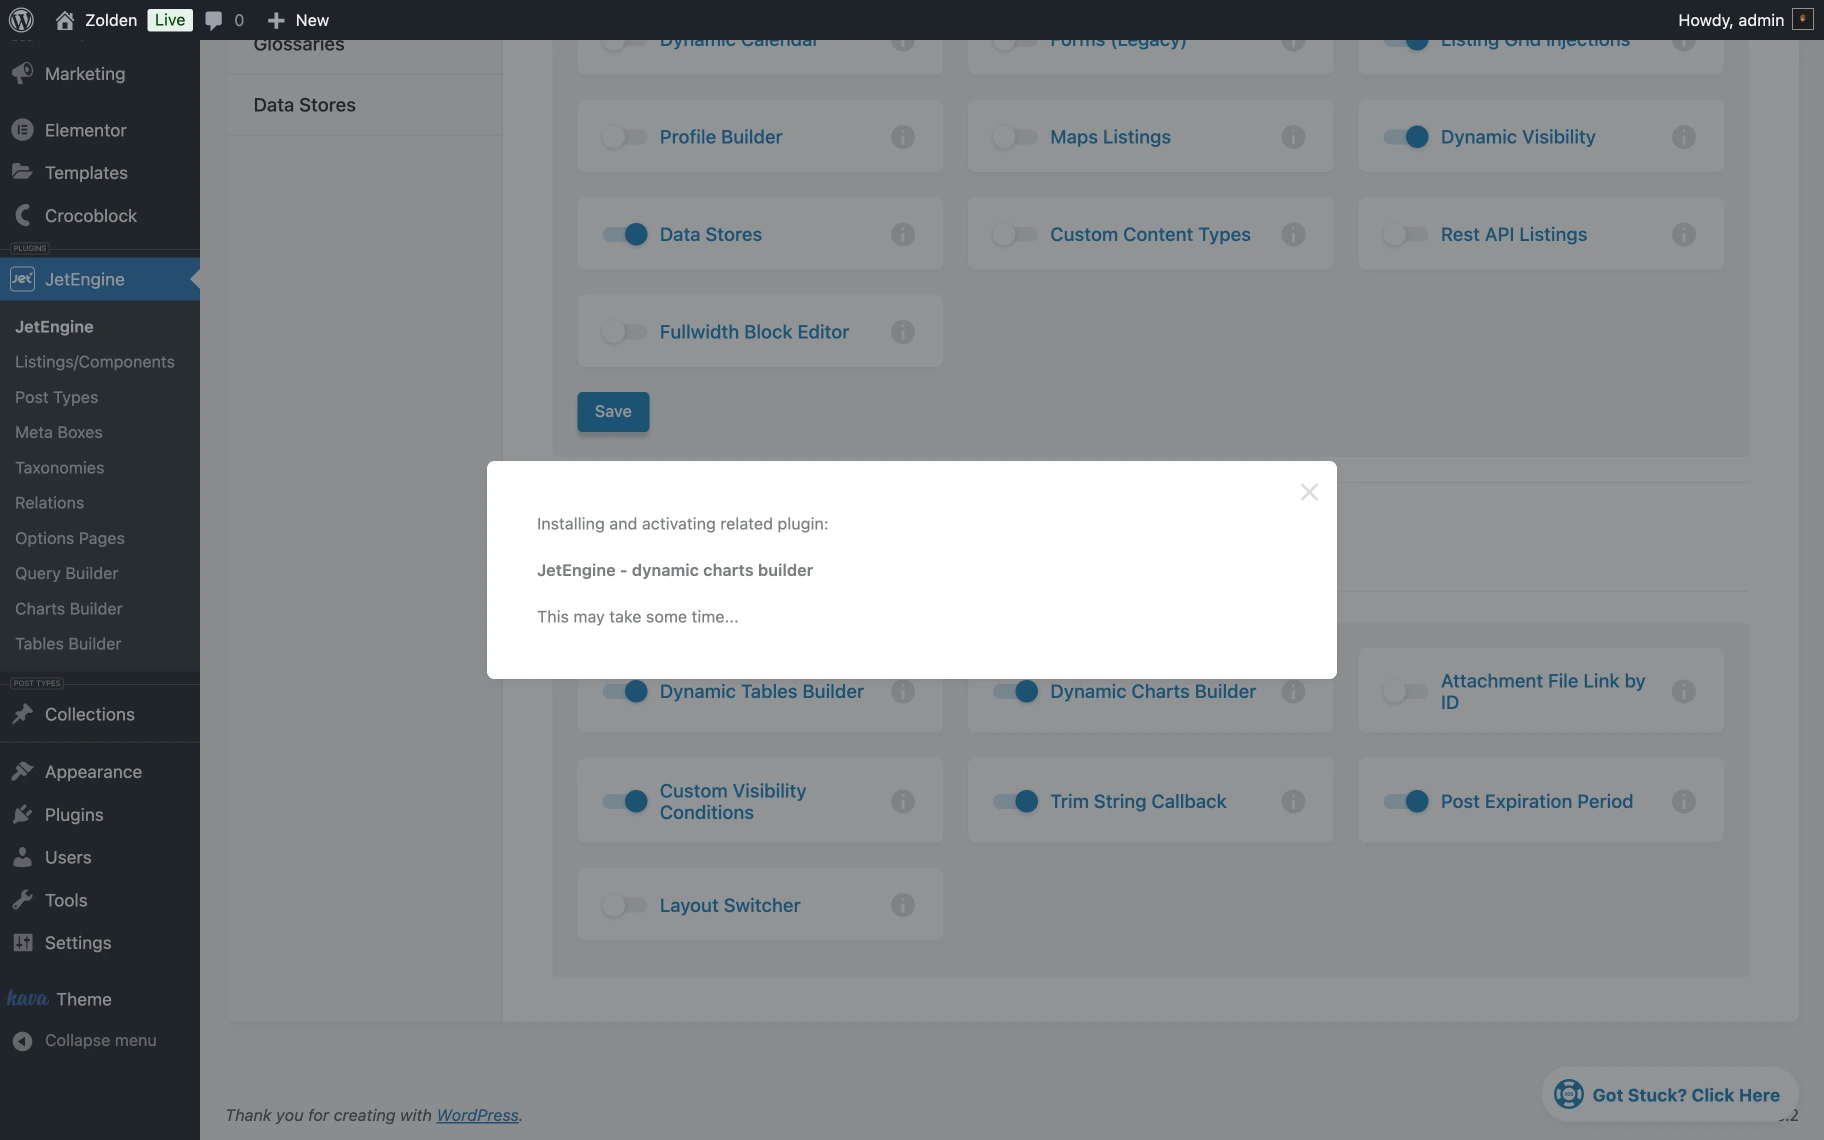
After enabling the switcher, a pop-up will appear saying that JetEngine is installing and activating a related plugin JetEngine – dynamic charts builder.
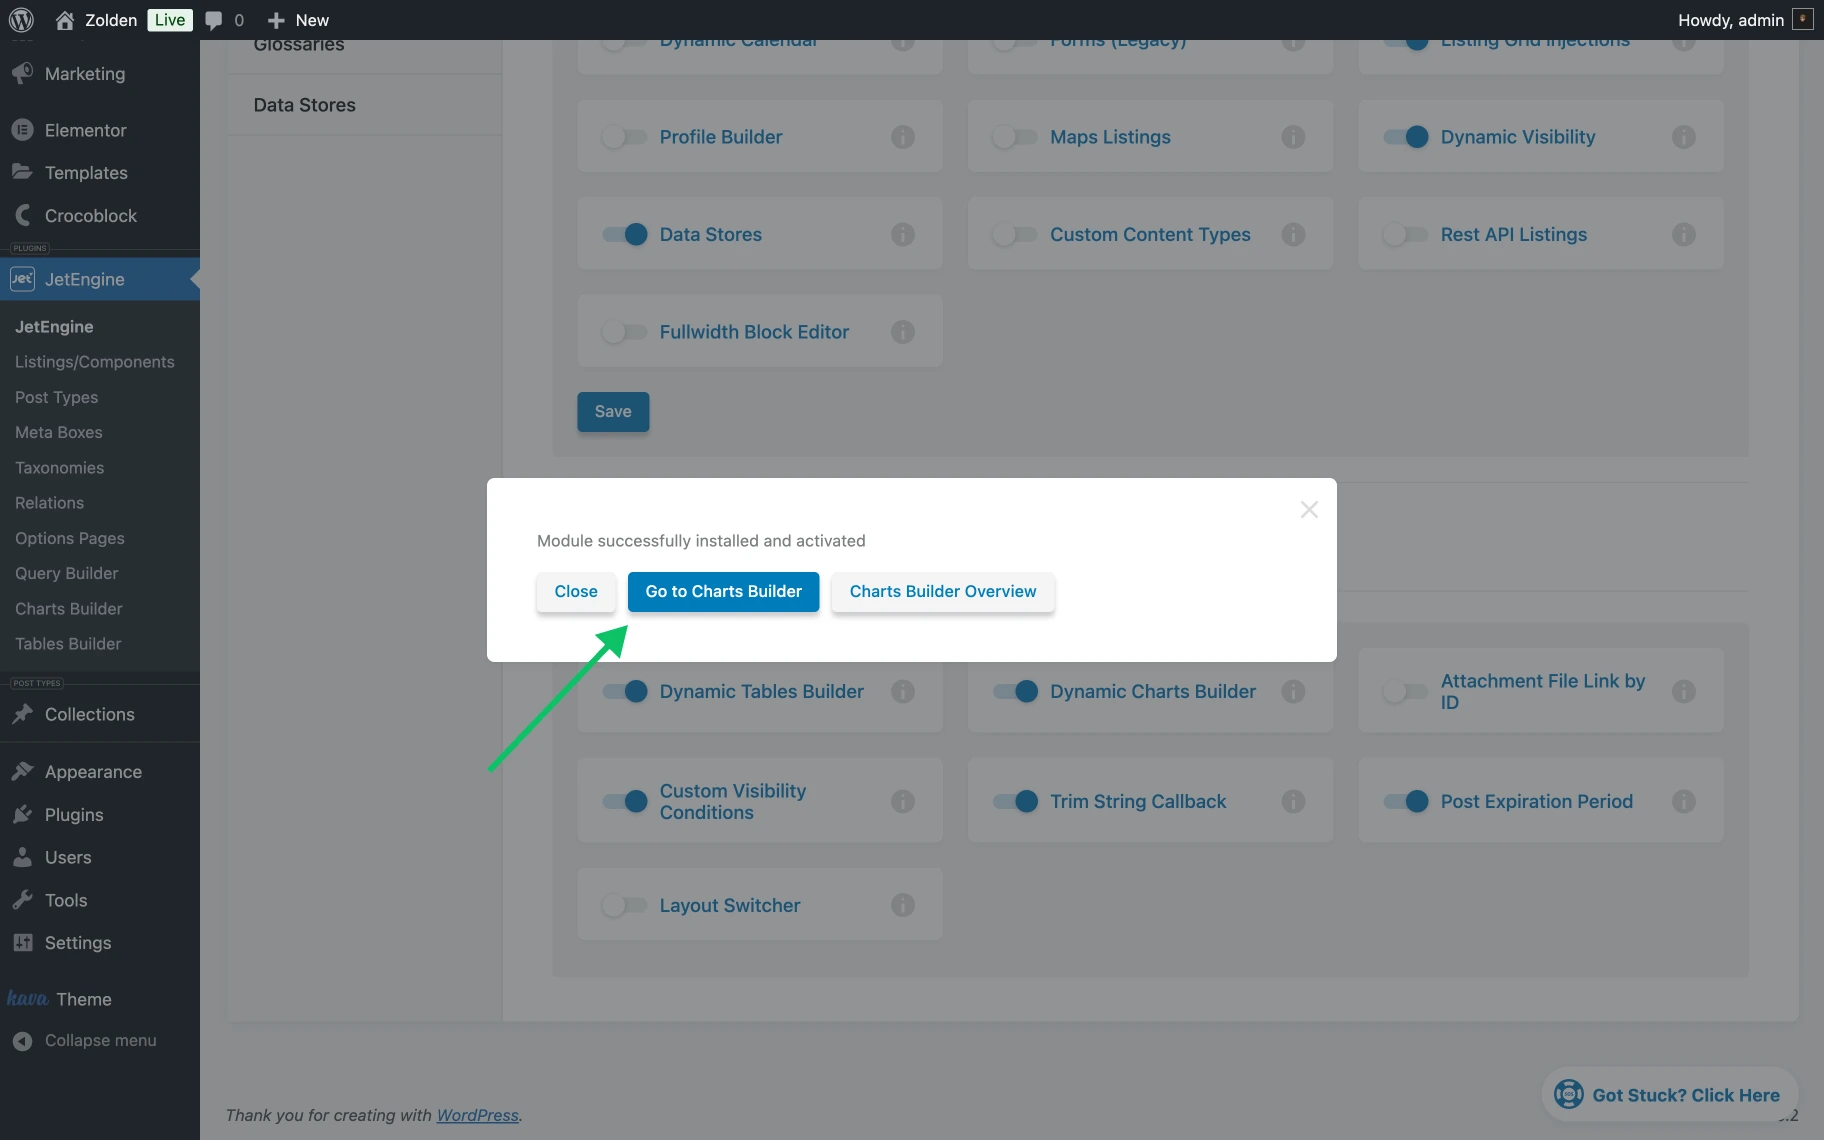
After installation, the pop-up message will change to the success state with a button saying, “Go to Charts Builder”. Upon clicking the button, a redirection to the Charts Builder page will occur.
The Charts Builder section can be accessed from the JetEngine dashboard for further exploration.
General Settings
This tab allows configuring the basic chart settings, including naming the chart, selecting or creating a data query, and fetching data to preview available columns.
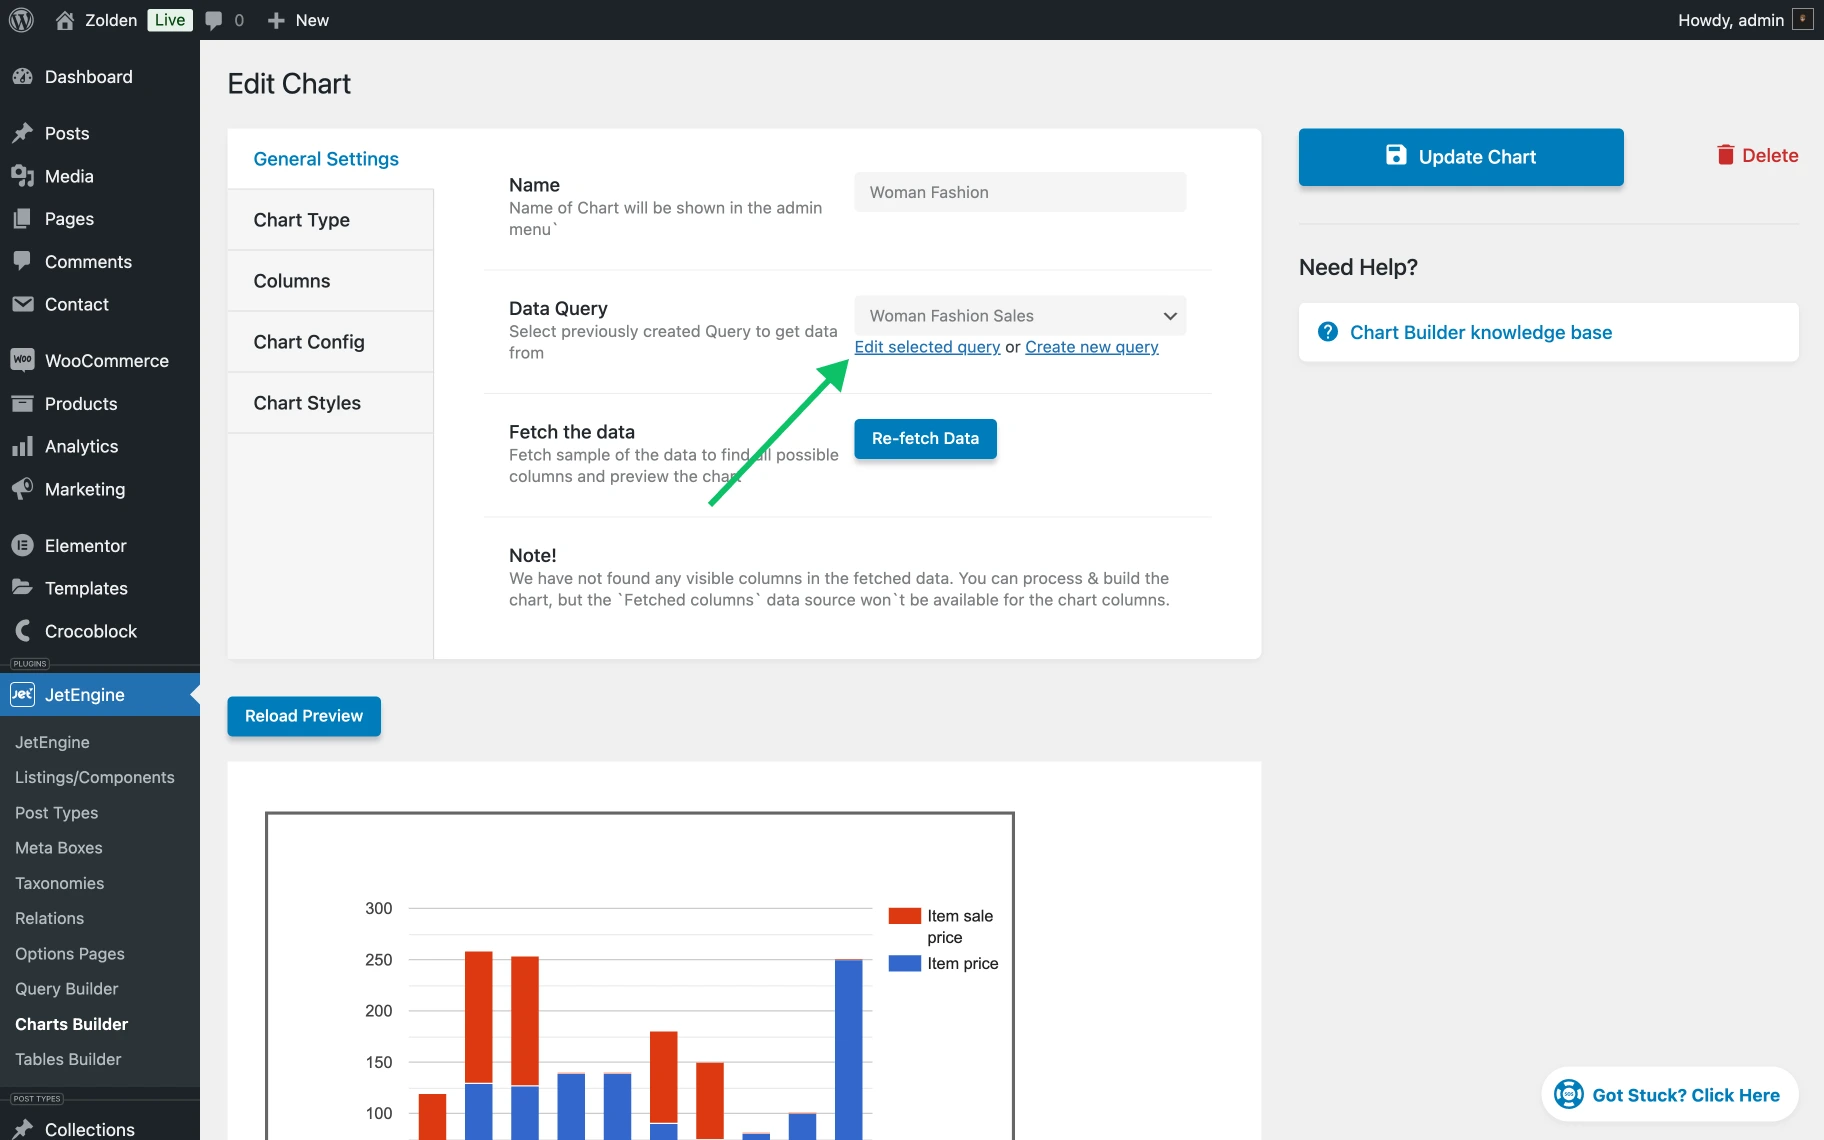
- Name — this feature allows adding the name of the chart;
- Data Query — this feature allows choosing the query that was created before with the Query Builder;
- Fetch the data — when clicked, this button allows fetching a sample of the data to find all possible columns and preview the table.
In our case scenario, we’re going to build a women’s fashion price chart. For our chart, we’re picking the query “Woman Fashion Sales”. This particular query is being used in this case, but depending on the context, another query is required. It’s important to ensure that the query creation process is completed before moving forward with building the chart.
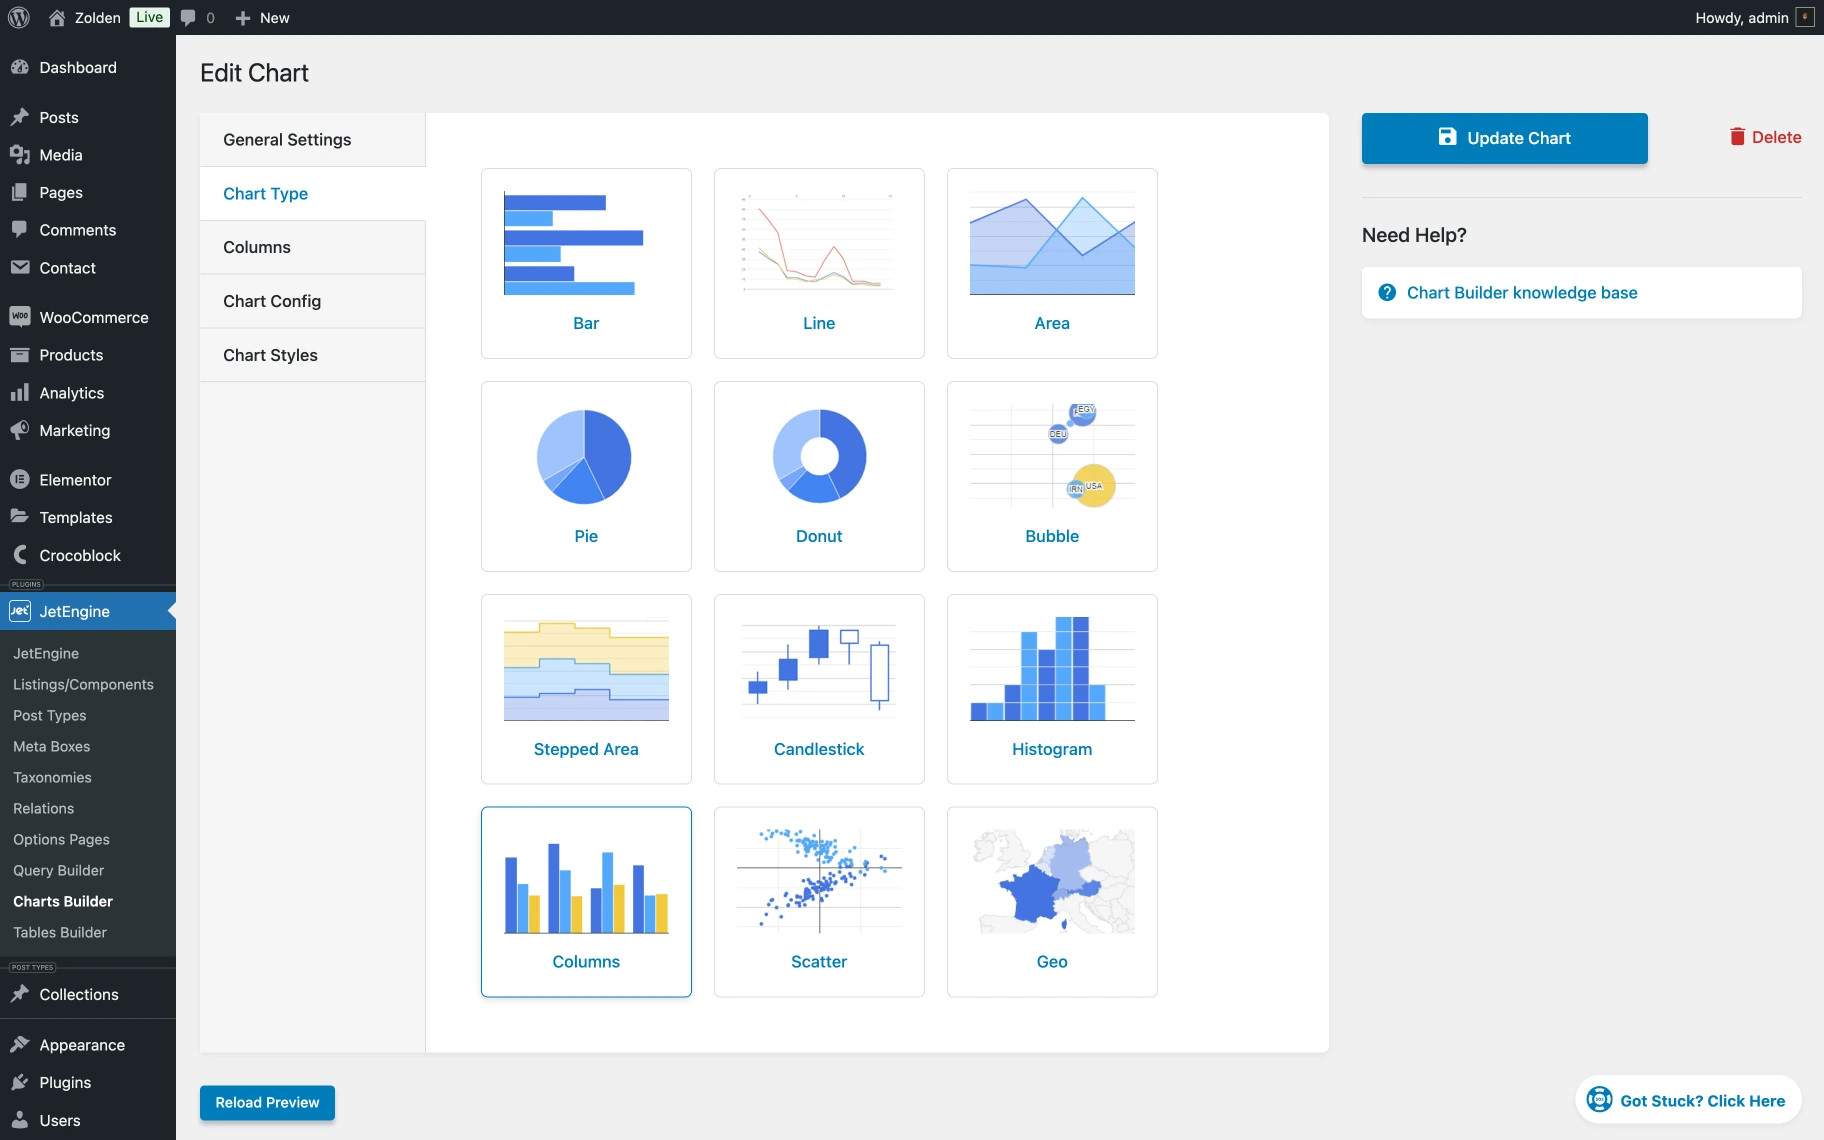
Chart Type
In this tab, the chart type can be selected from the available options, such as “Bar,” “Line,” “Pie,” “Geo,” “Histogram,” and many others. In our case, we’ll choose the chart type “Columns.”
Columns
Here, one can add the required data for the chart. It will work similarly to the meta fields.
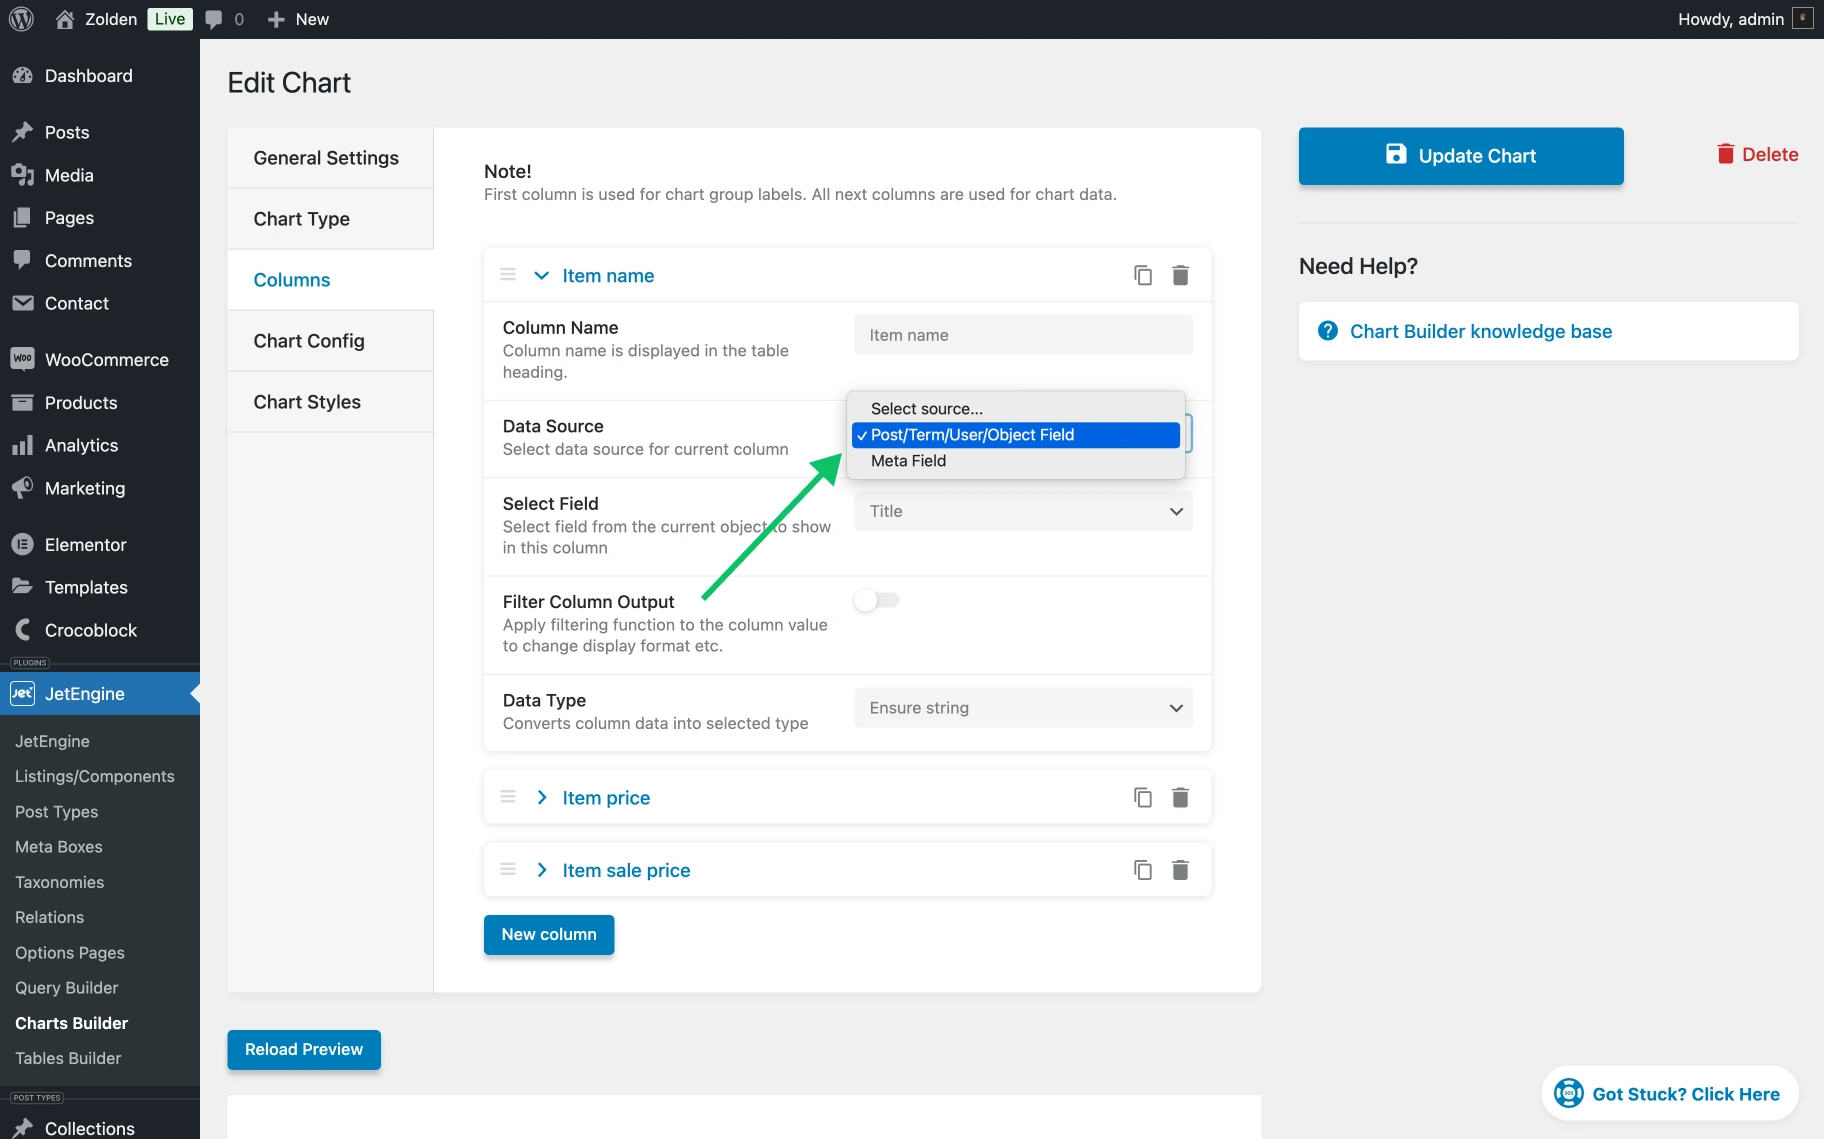
- Column Name — this feature allows one to set the name of the column;
- Data Source — this feature allows choosing data sources for the column. Two options are available: “Post/Term/User/Object Field” and “Meta Field.”
- Select Field — this feature allows selecting a field from the current objects to show in this column;
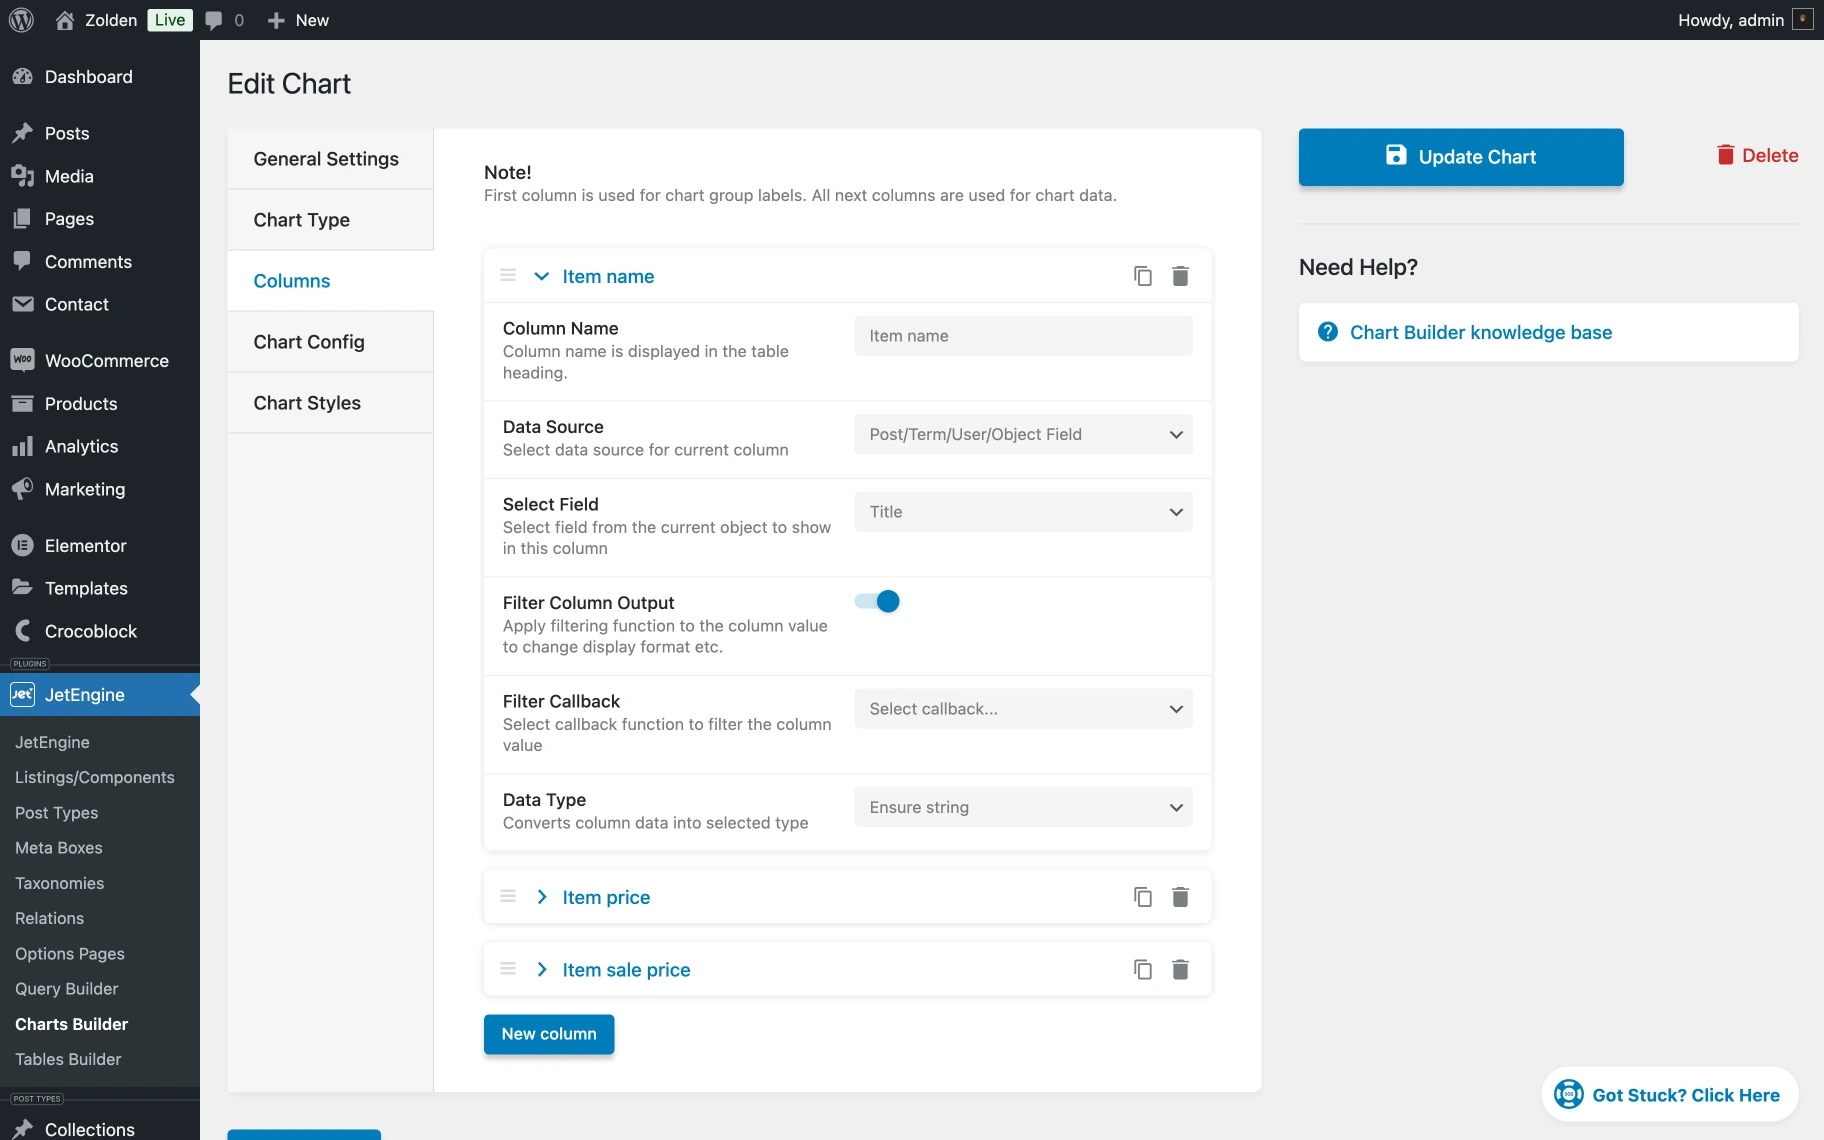
- Filter Column Output — a feature that is deactivated by default. When toggling the switcher, one can change how information is shown in a specific column. For example, if a column displays dates, this feature can automatically change the format of those dates to present them differently. When activated, an additional field will appear:
- Filter Callback — this feature allows one to pick an option from the dropdown to choose the custom function to modify or adjust the data in a column;
- Data Type — this feature allows converting column data into the selected type; choose between “Default,” “Ensure number,” and “Ensure string.”
For our column chart, we’re going to create three columns:
- First column — Item name:
- Column Name — ”Item name”;
- Data Source — “Post/Term/User/Object Field”;
- Select Field — ”Title”;
- Data Type — ”Ensure string”;
- Second column — Item price:
- Column Name — ”Item price”;
- Data Source — “Post/Term/User/Object Field”;
- Select Field — ”Plain Price”;
- Data Type — ”Ensure string”;
- Third column — Item sale price:
- Column Name — ”Item sale price”;
- Data Source — “Post/Term/User/Object Field”;
- Select Field — ”Plain Sale Price”;
- Data Type — ”Ensure string”.
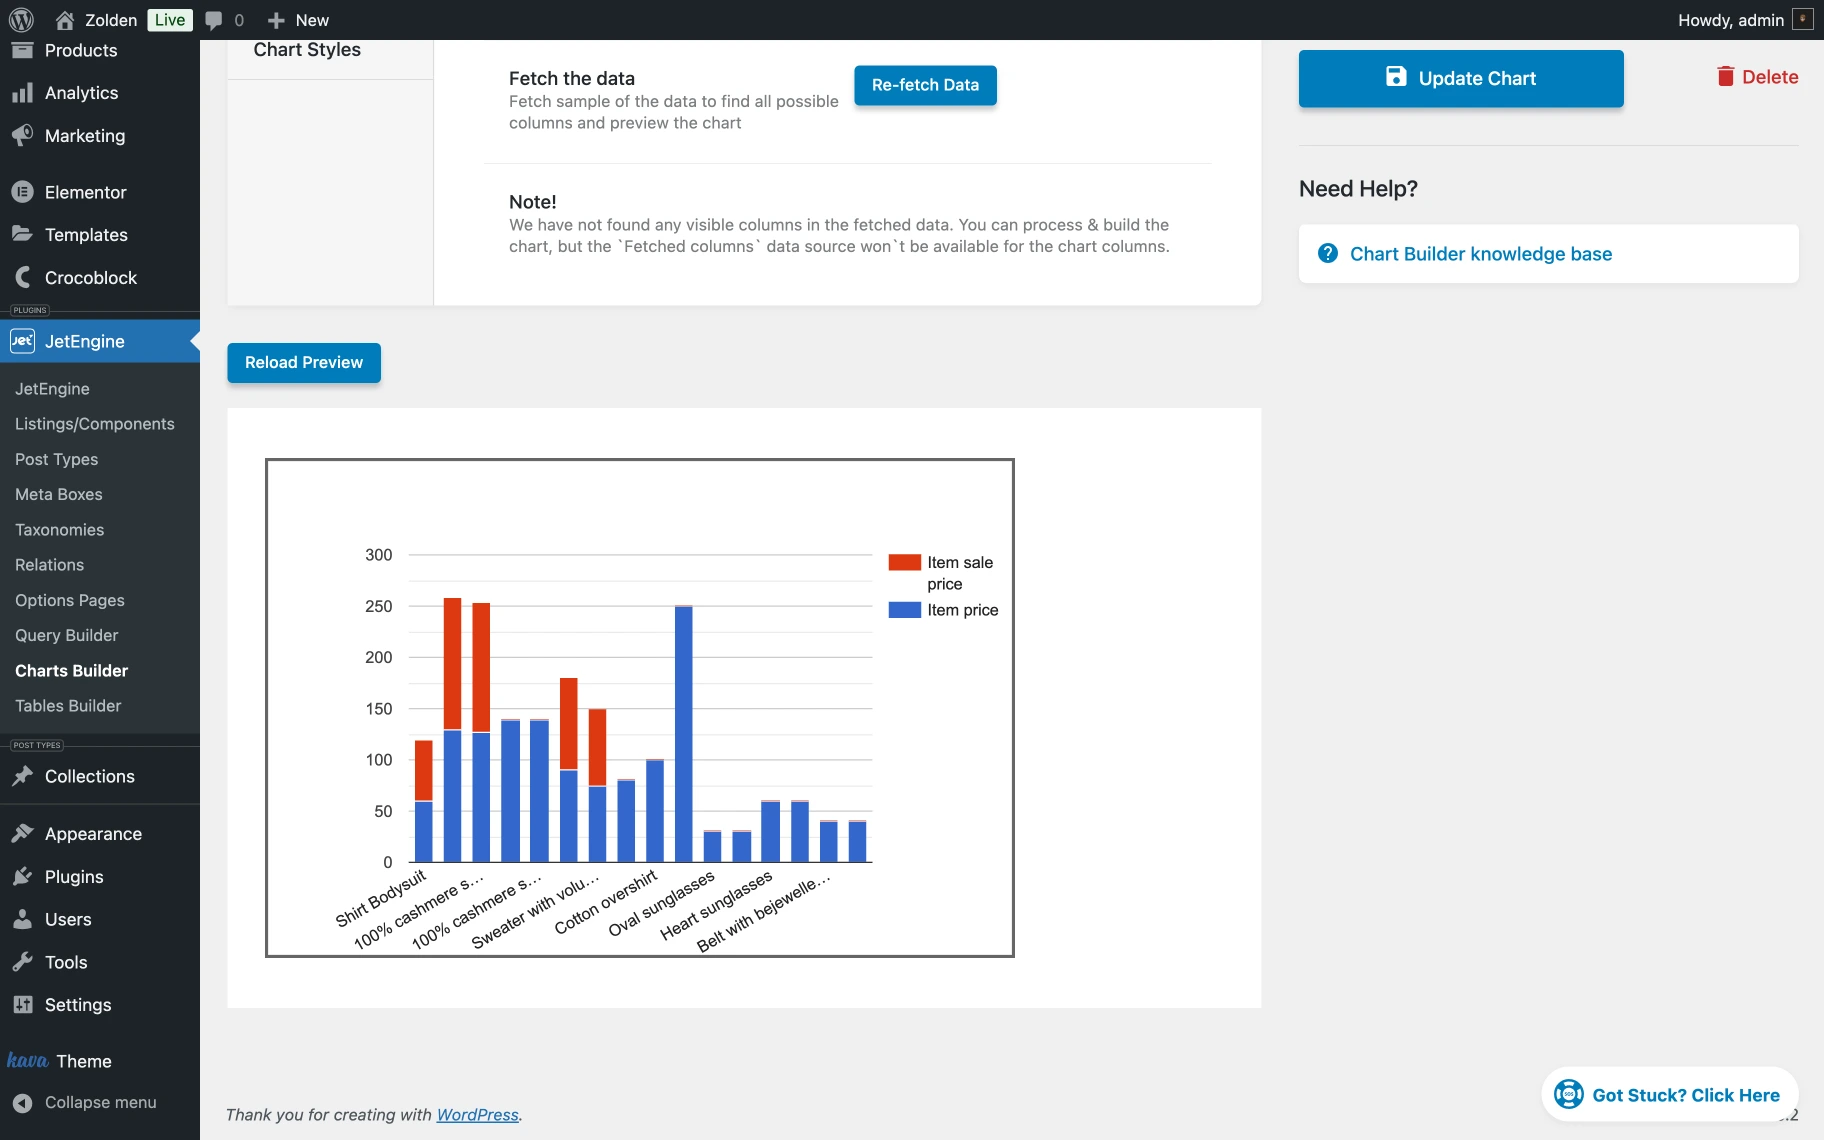
Once the settings are configured, the “Reload Preview” button can be pressed to draw the chart.
To display fewer items in the chart, one can use the Pagination settings from the Query Builder. Query Builder is accessible via the path: WordPress Dashboard > JetEngine > Query Builder.
In the list of available queries, there is an option that corresponds to the one selected on the General Settings tab of the Chart Builder, which can be edited.
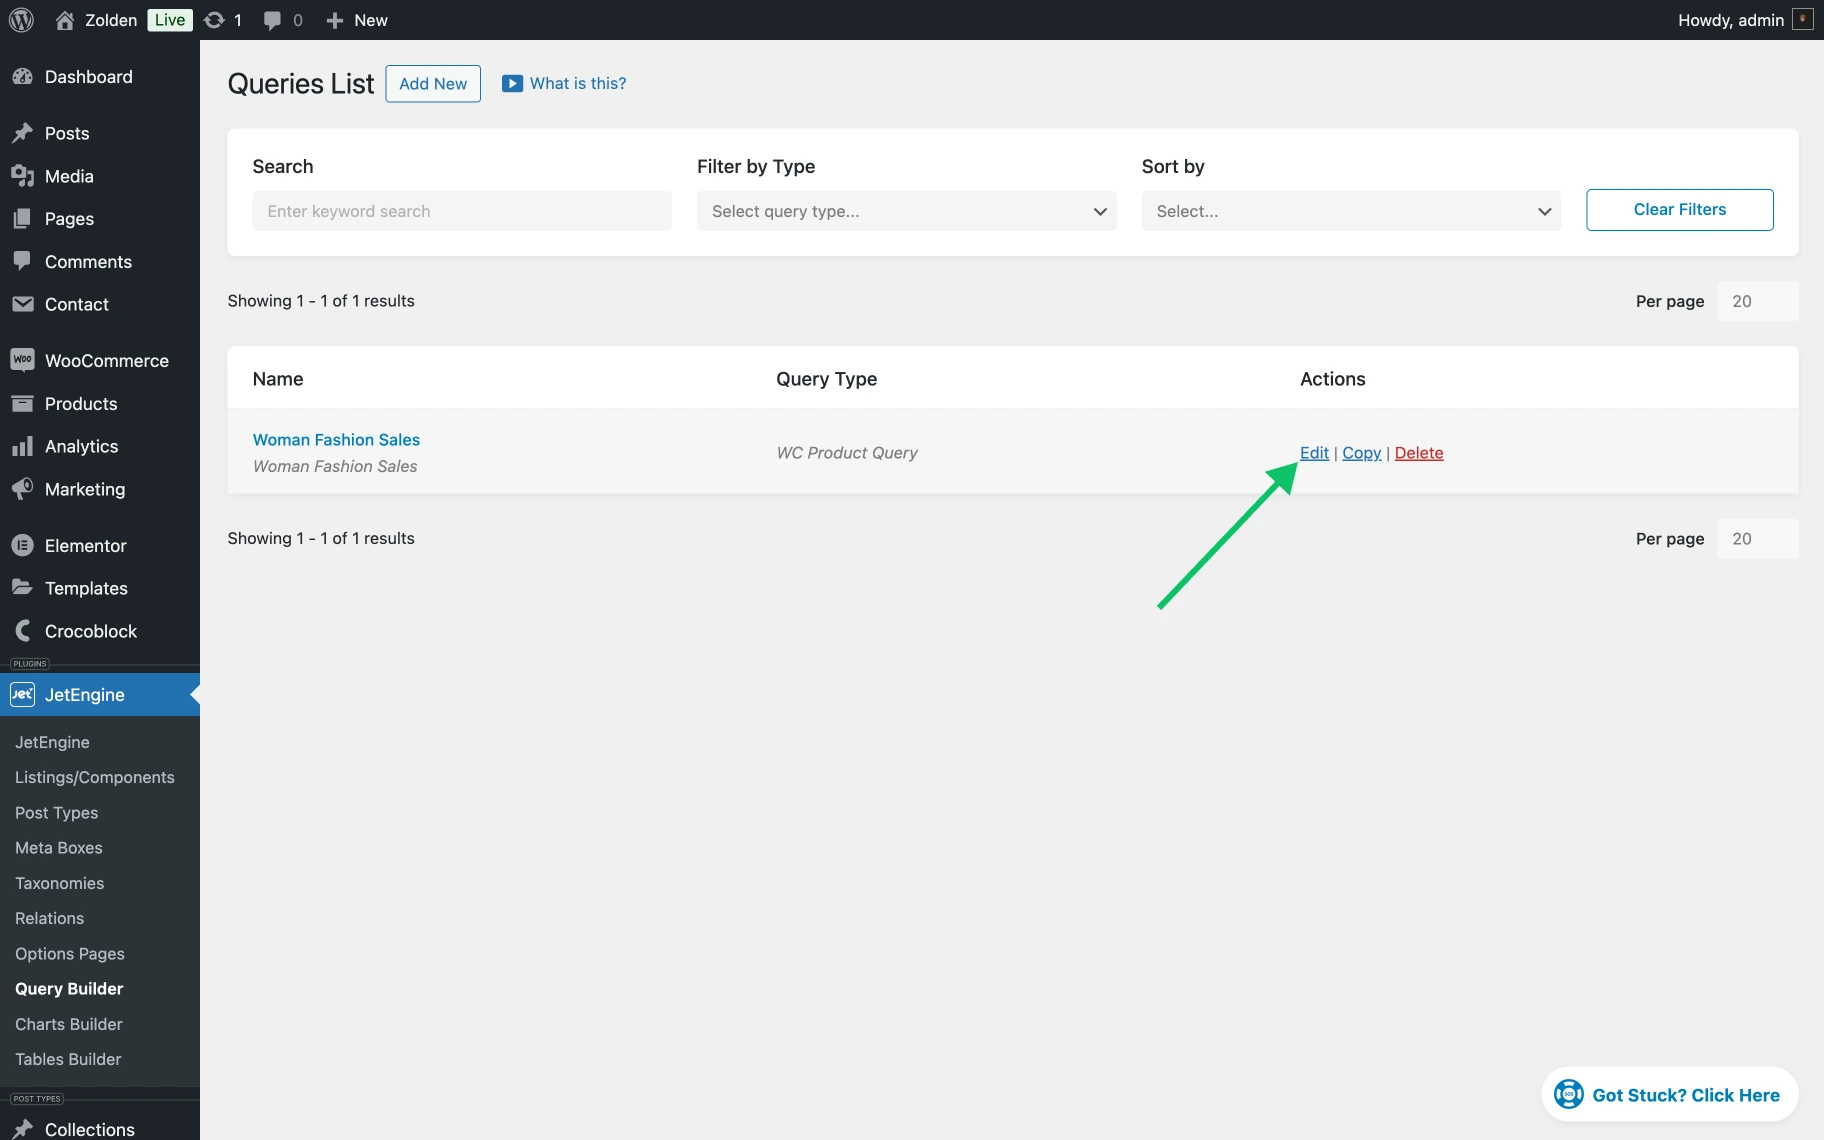
In the WC Product Query, the appropriate Limit can be set in the Pagination tab.
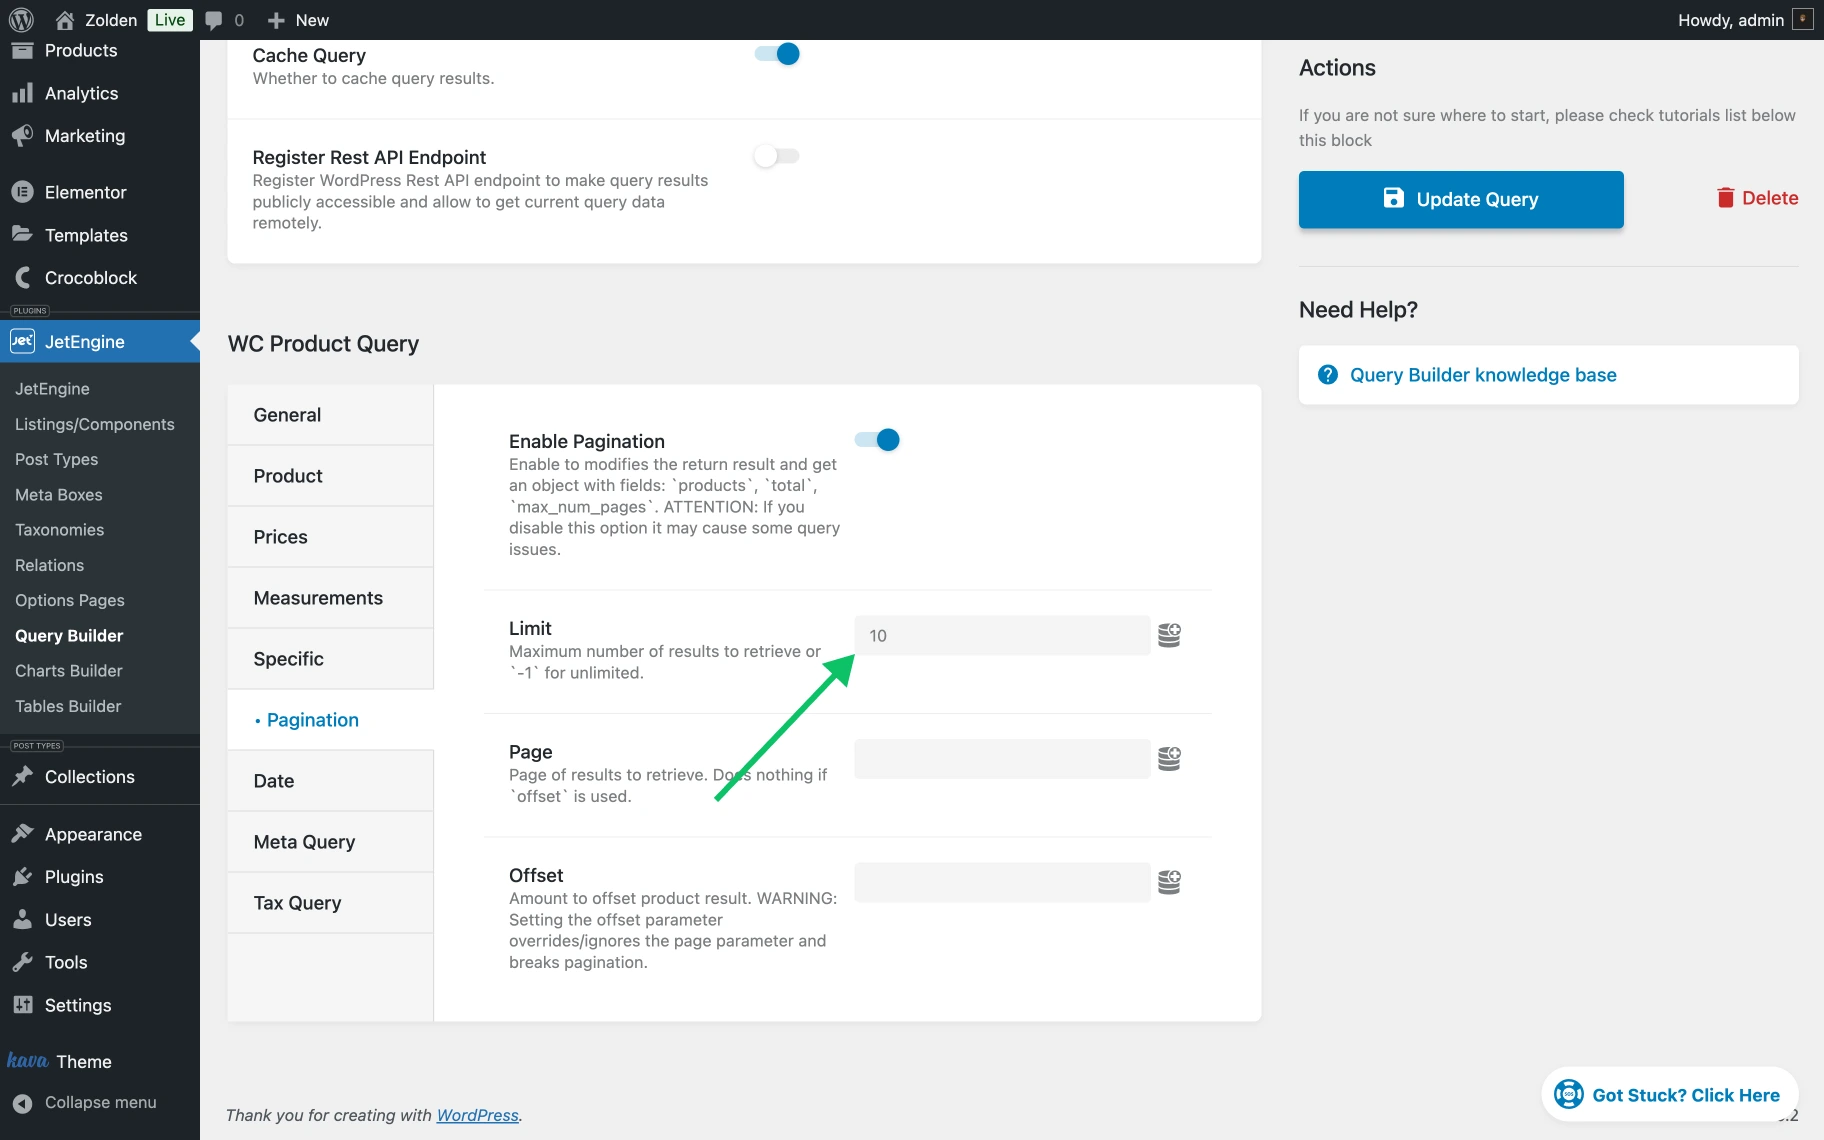
The Pagination determines how many items (products, posts, appointments, etc.) are shown on each page. For example, when set to “10,” one will see ten products per page.
We’ve set the limit to “10,” and as a result, we’ll see only ten products in the chart preview.
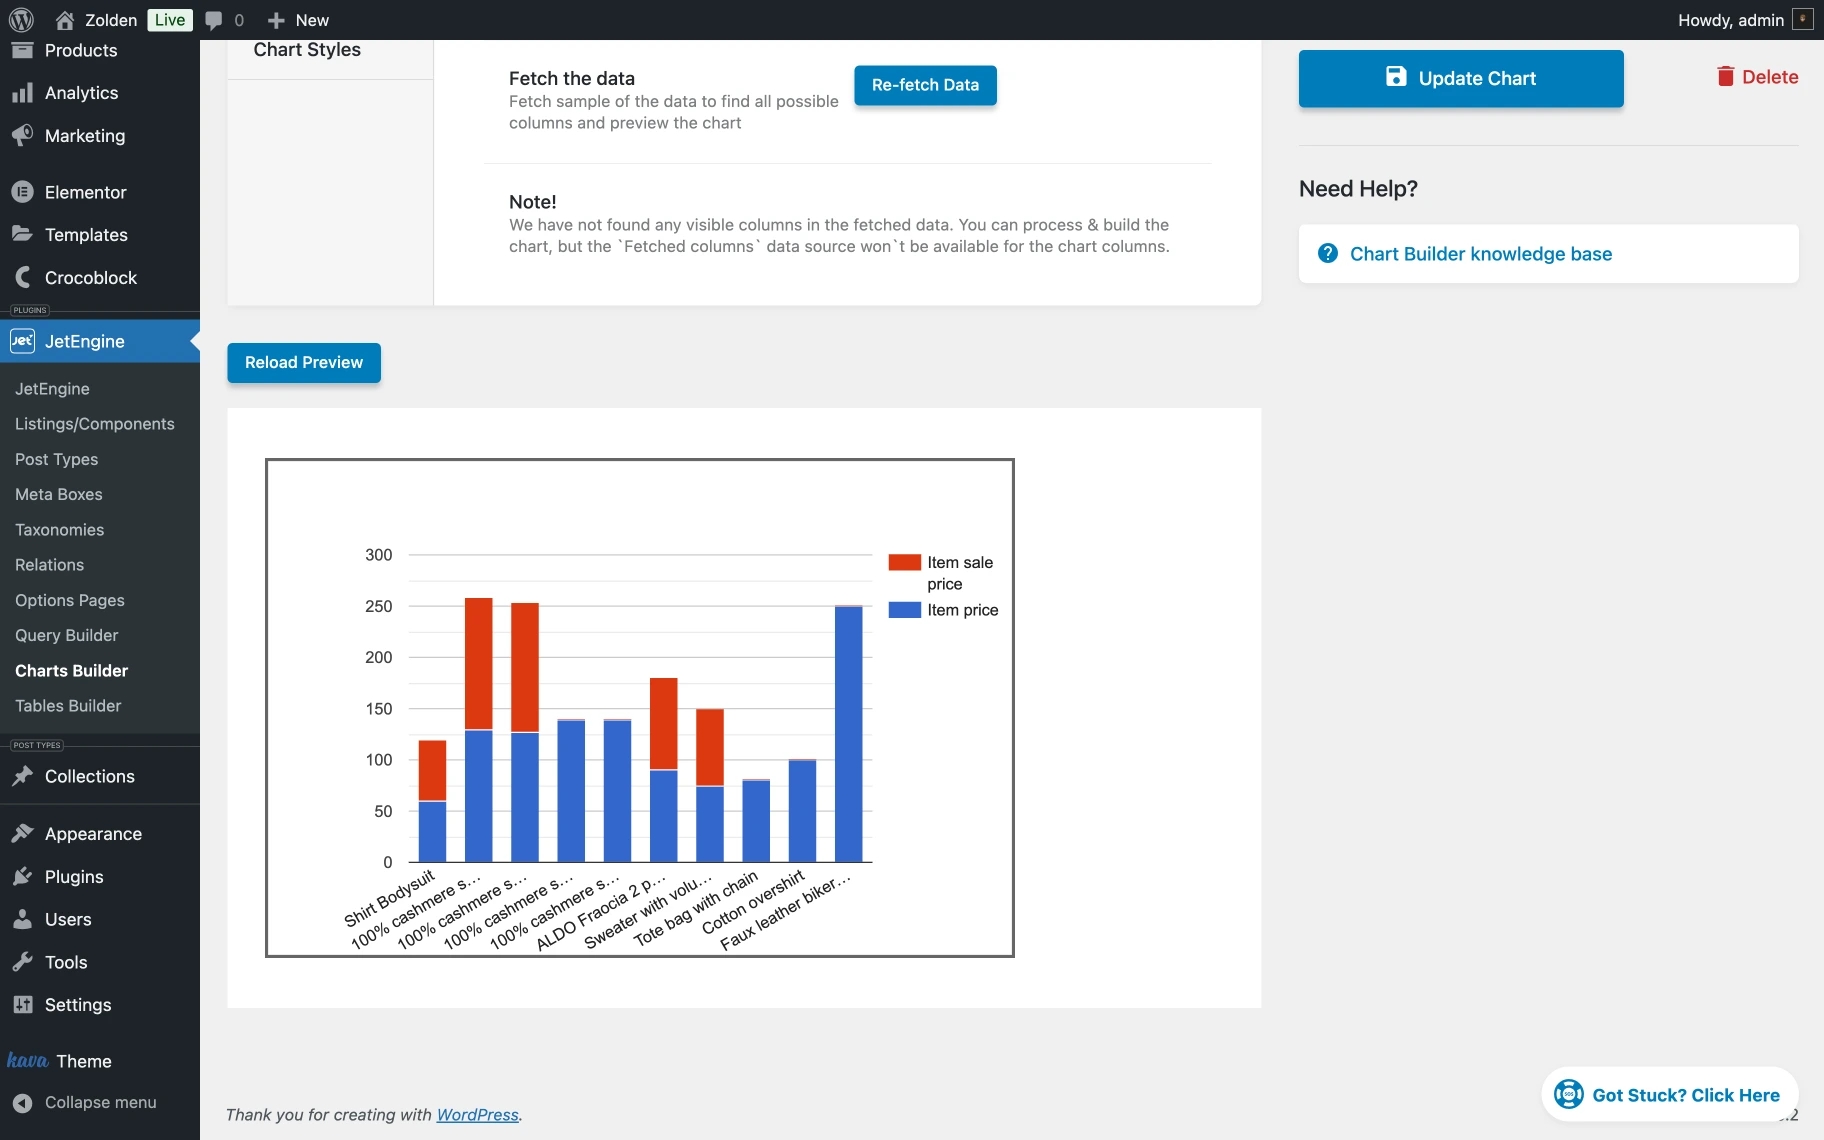
Chart Config
In this section, the appearance and behavior of the chart are customizable, including options for the legend position, stacking, and advanced settings through JSON for detailed adjustments.
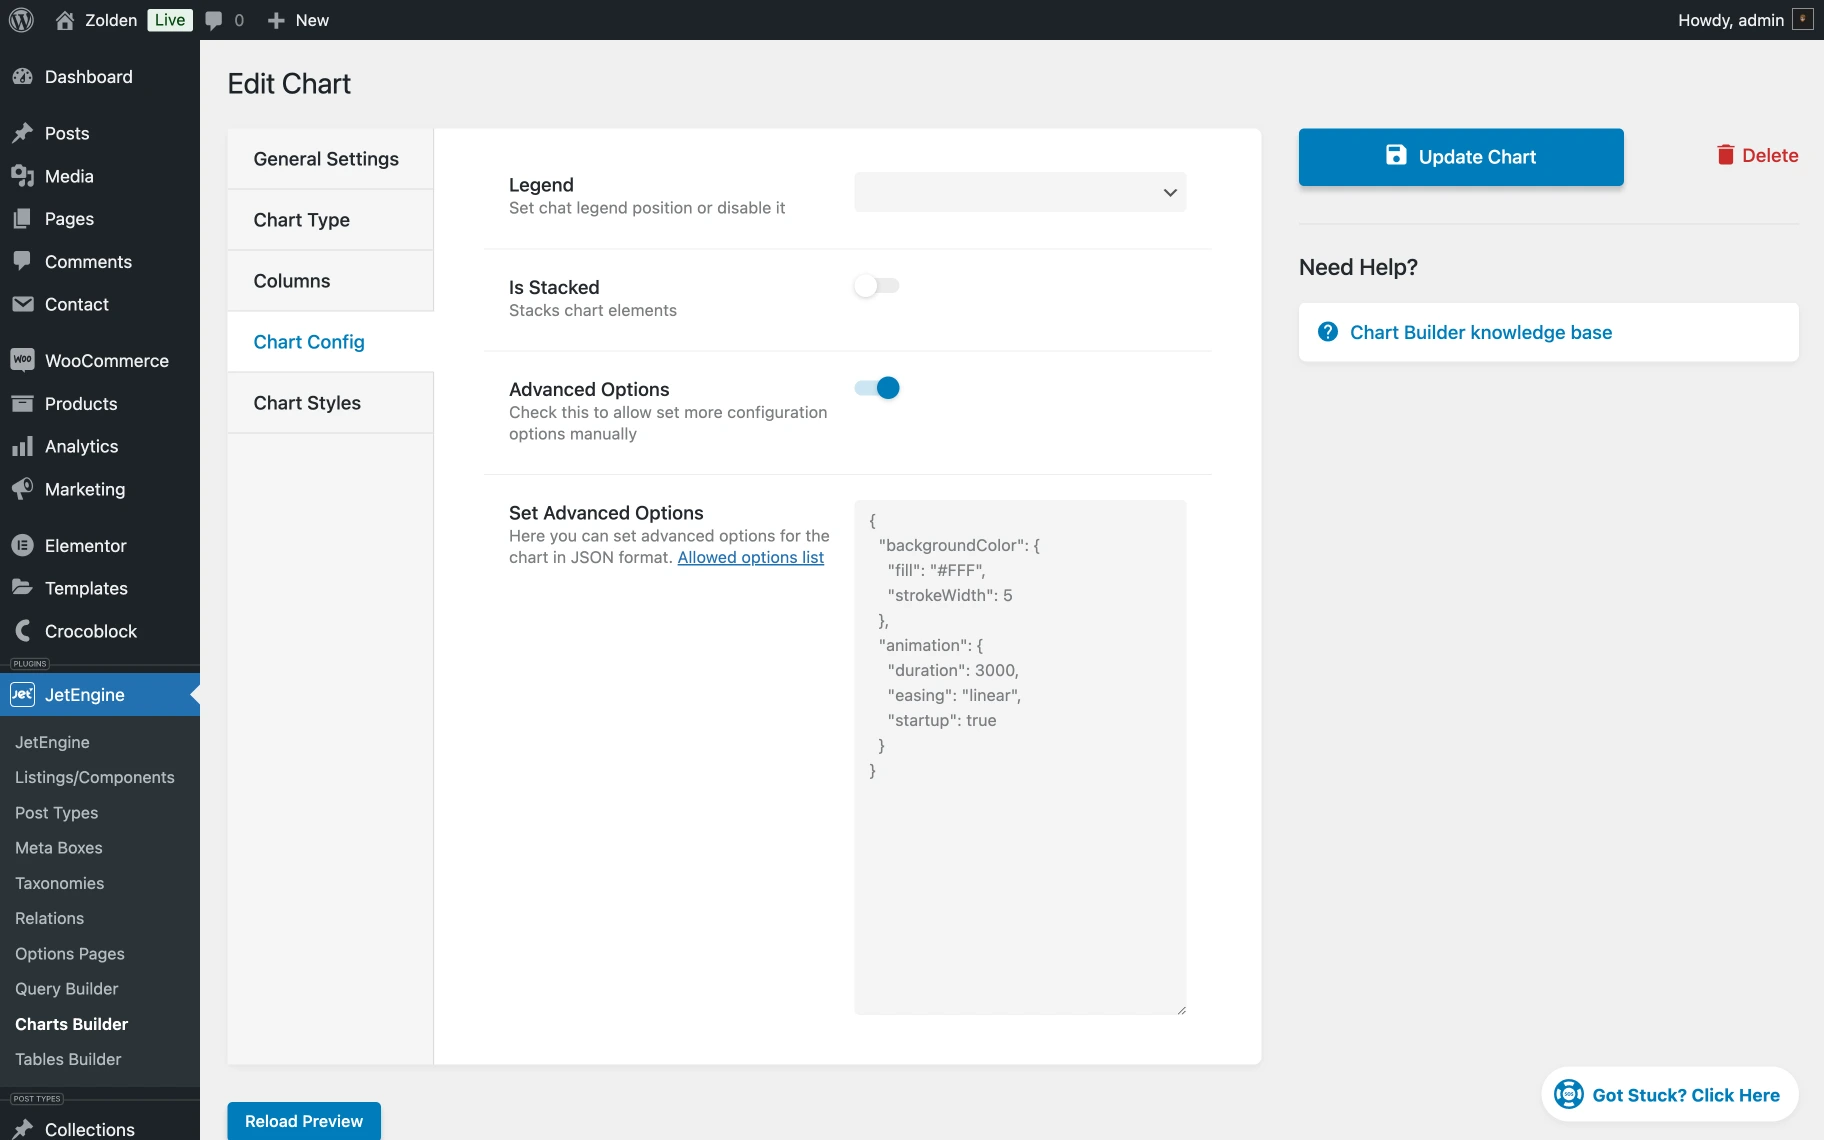
- Legend — this feature allows one to set the chart legend position to the right or to the left or turn it off;
- Is Stacked — this feature allows to combine chart elements into a stacked format;
- Advanced Options — a feature that is deactivated by default. When the toggle is enabled, it allows one to set more configuration options manually. After enabling this feature, the Set Advanced Options field will appear. Here, one can set advanced options for the chart in JSON format. Please check the Allowed options list to see what can be added. We’ll add the following:
{
  "backgroundColor": {
    "fill": "#FFF",
    "strokeWidth": 5
  },
  "animation": {
    "duration": 3000,
    "easing": "linear",
    "startup": true
  }
}
To check the results, the “Reload Preview” button should be pressed.
Without the Advanced Option, the chart can not be animated.
Chart Styles
In this tab, one can adjust the width and set the height for the chart in pixels.
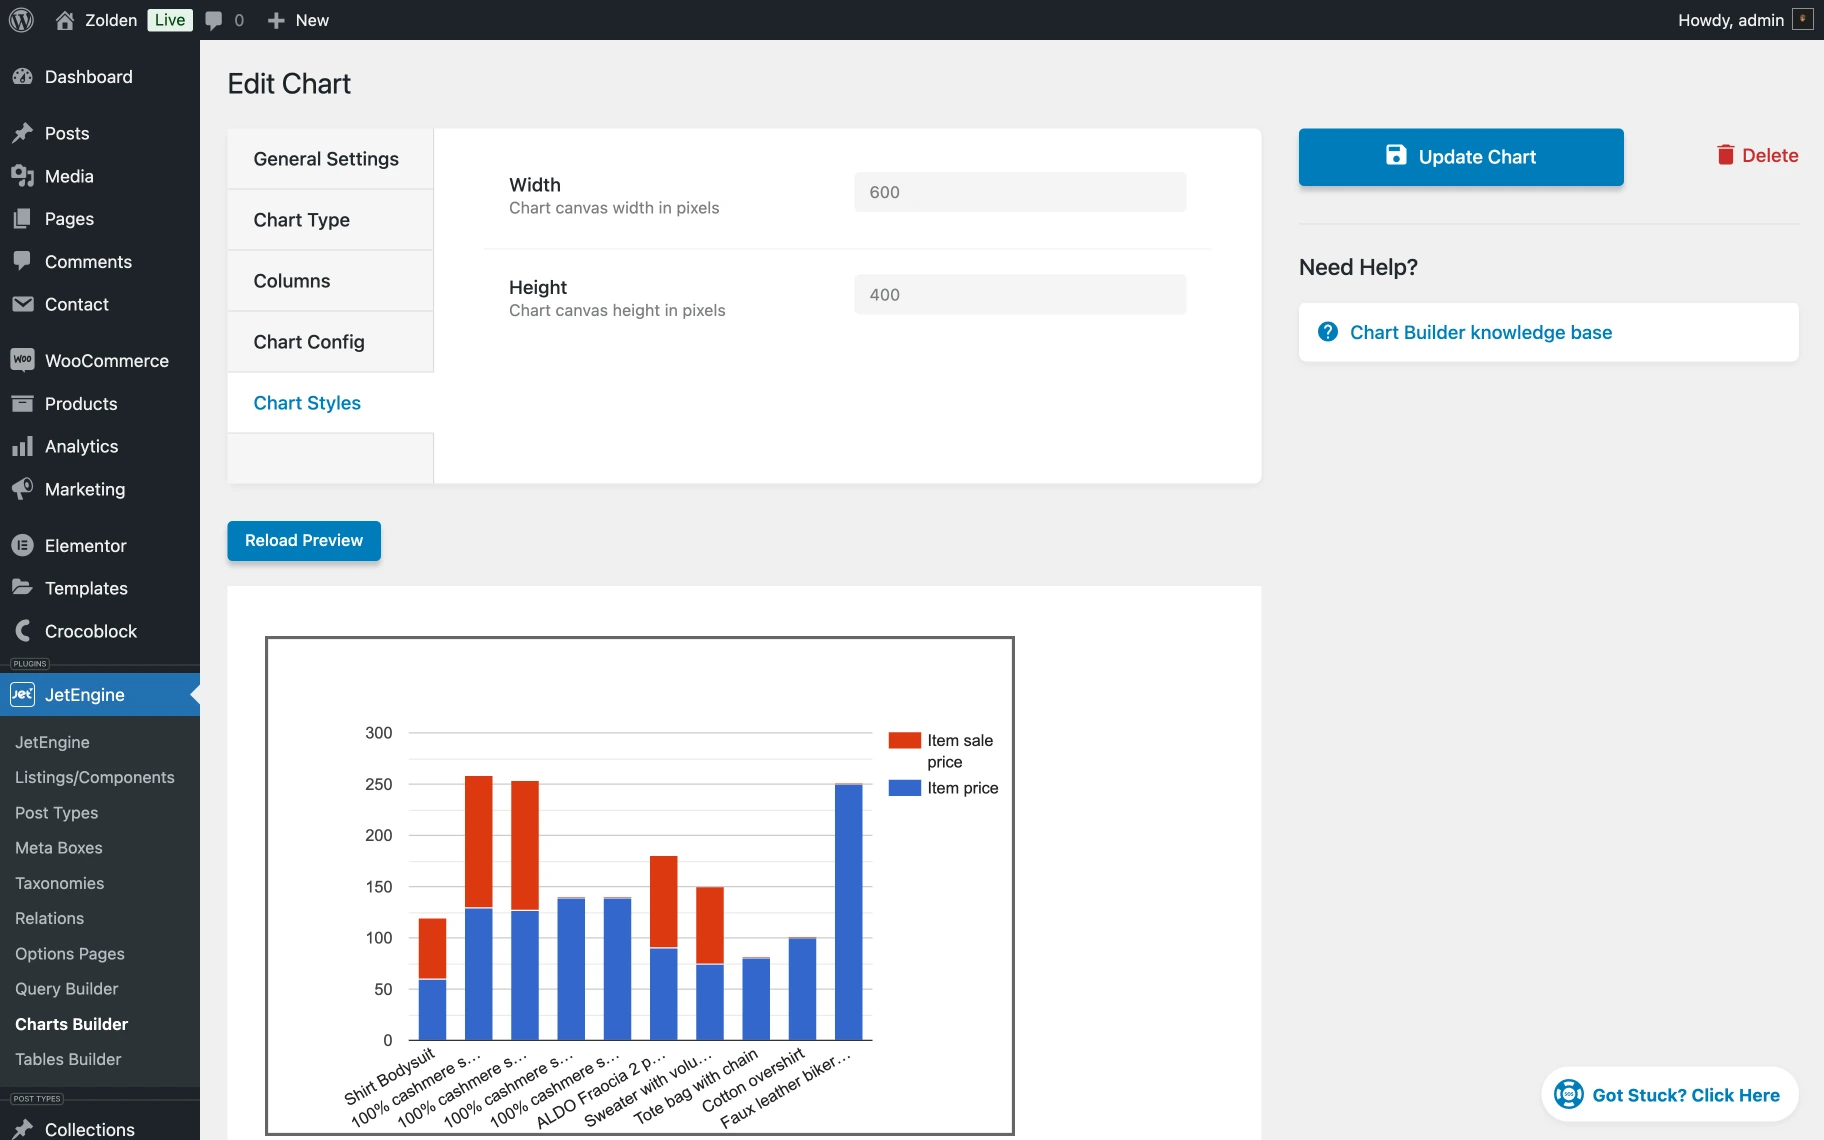
- Width — this feature allows setting the width of the chart canvas in pixels;
- Height — this feature allows setting the height of the chart canvas in pixels.
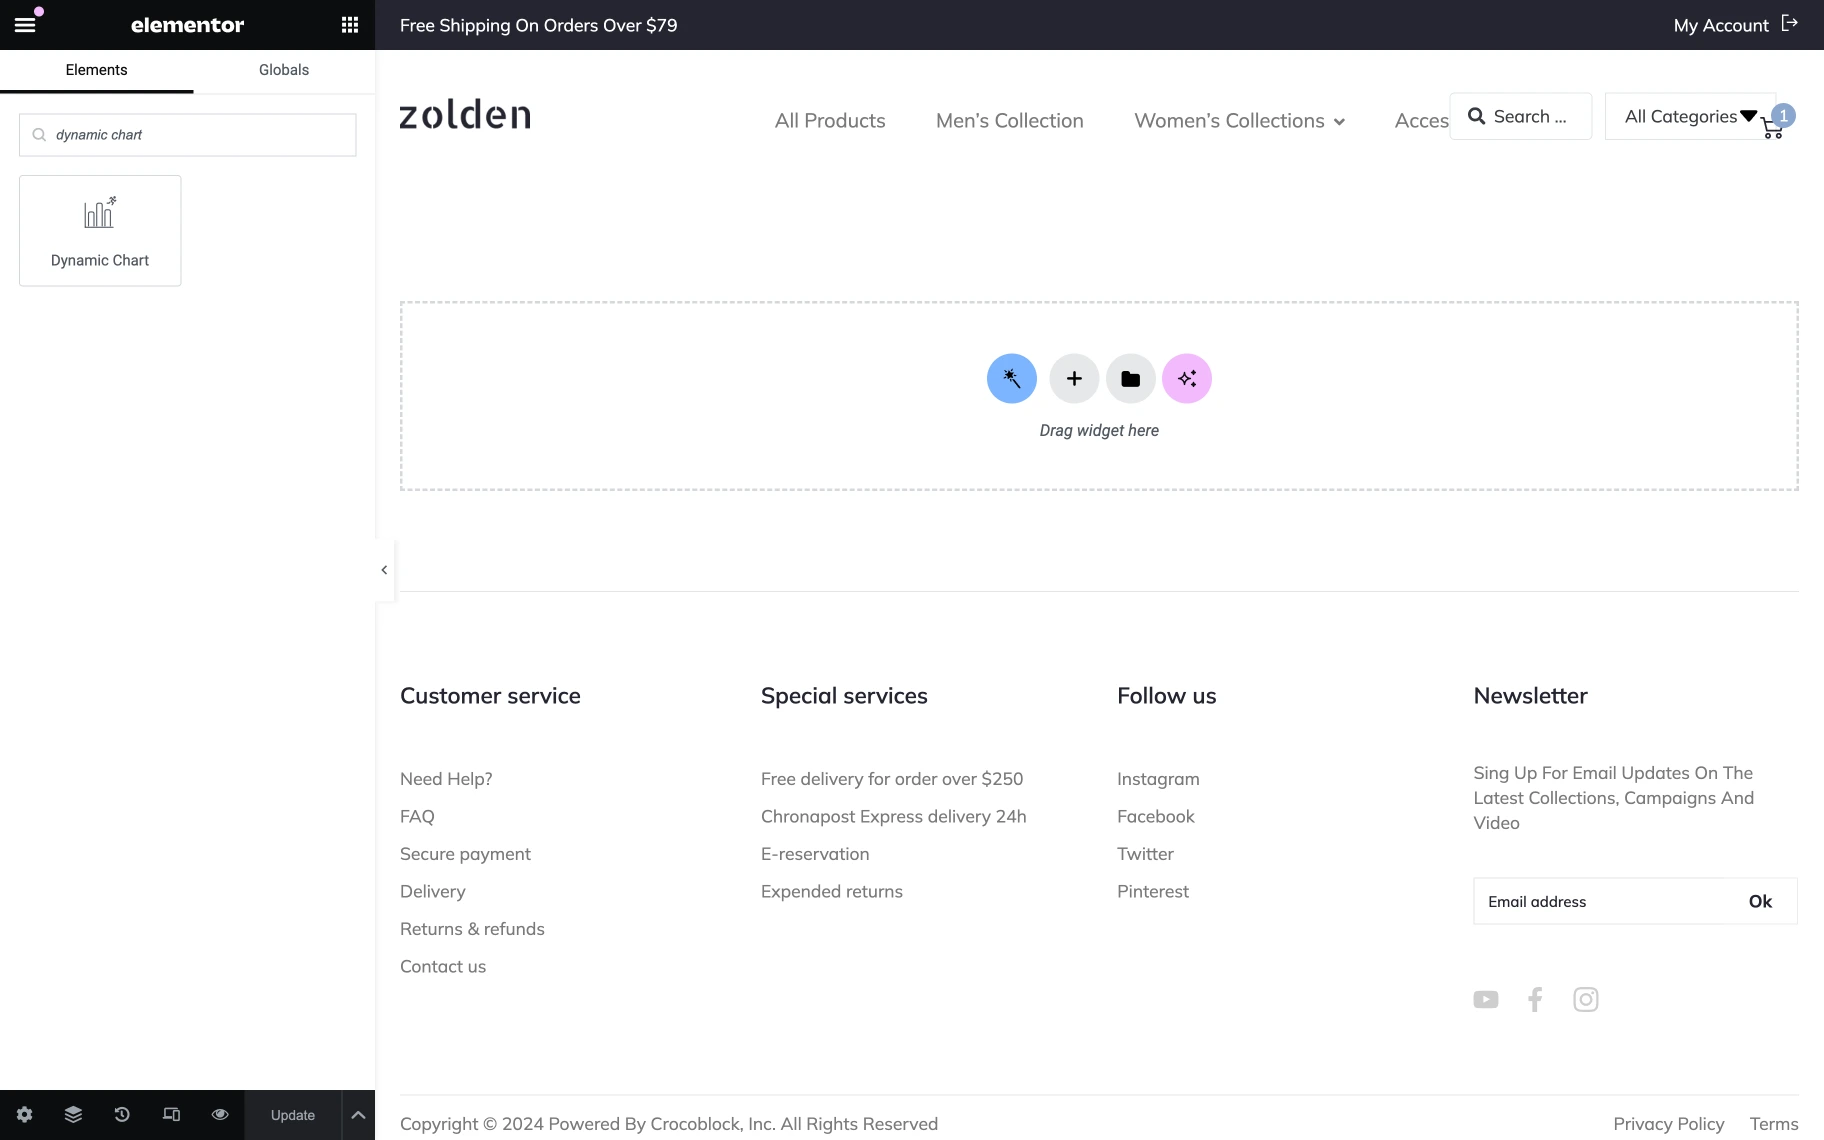
Dynamic Chart Widget in Elementor
There’s an opportunity to display the chart on any page with a Dynamic Chart widget. The desired page should be accessed, with the “Edit with Elementor” clicked. The Dynamic Chart widget can be found in the list of widgets using the search function and added to the page.
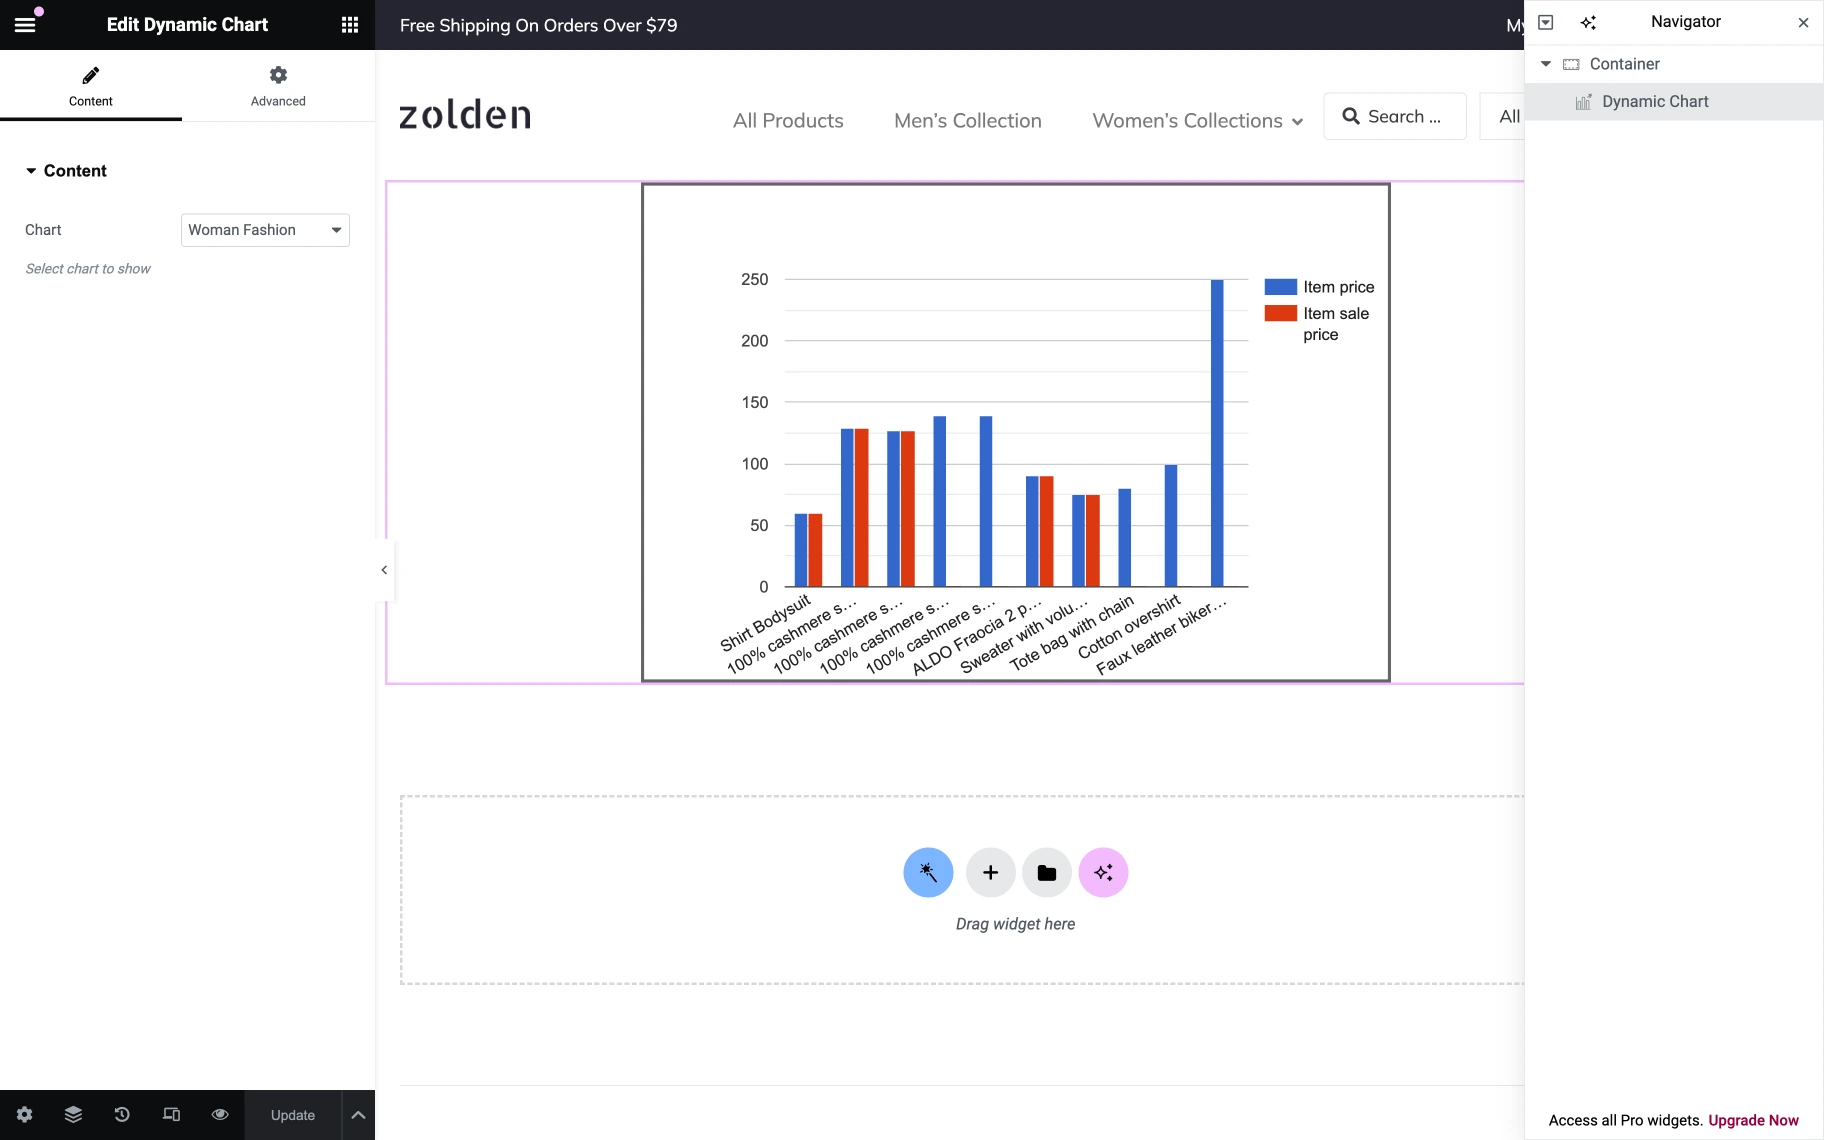
In the Chart field, one can choose the chart that was created before.
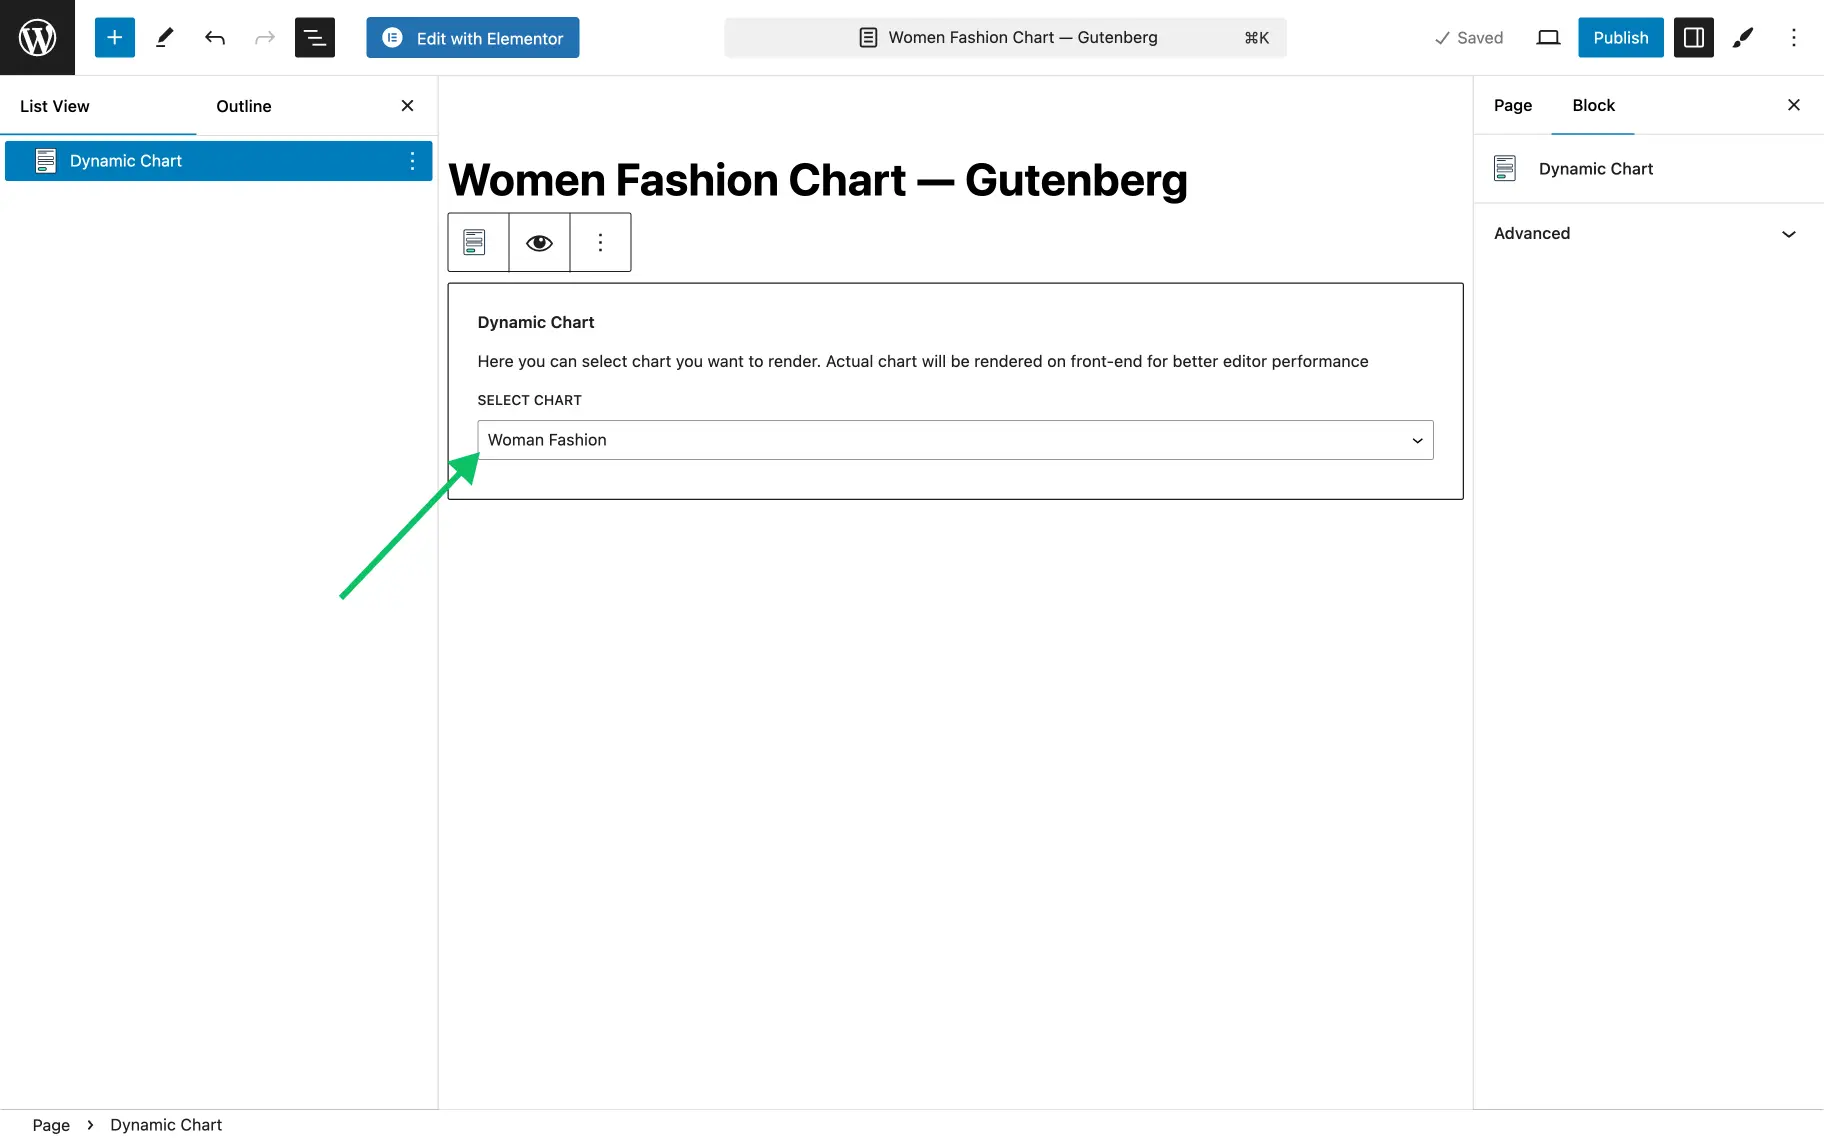
Dynamic Chart Block in Gutenberg
One can also add the Dynamic Chart widget in Gutenberg. The necessary page can be opened, and the “plus” icon used to locate the Dynamic Chart block.
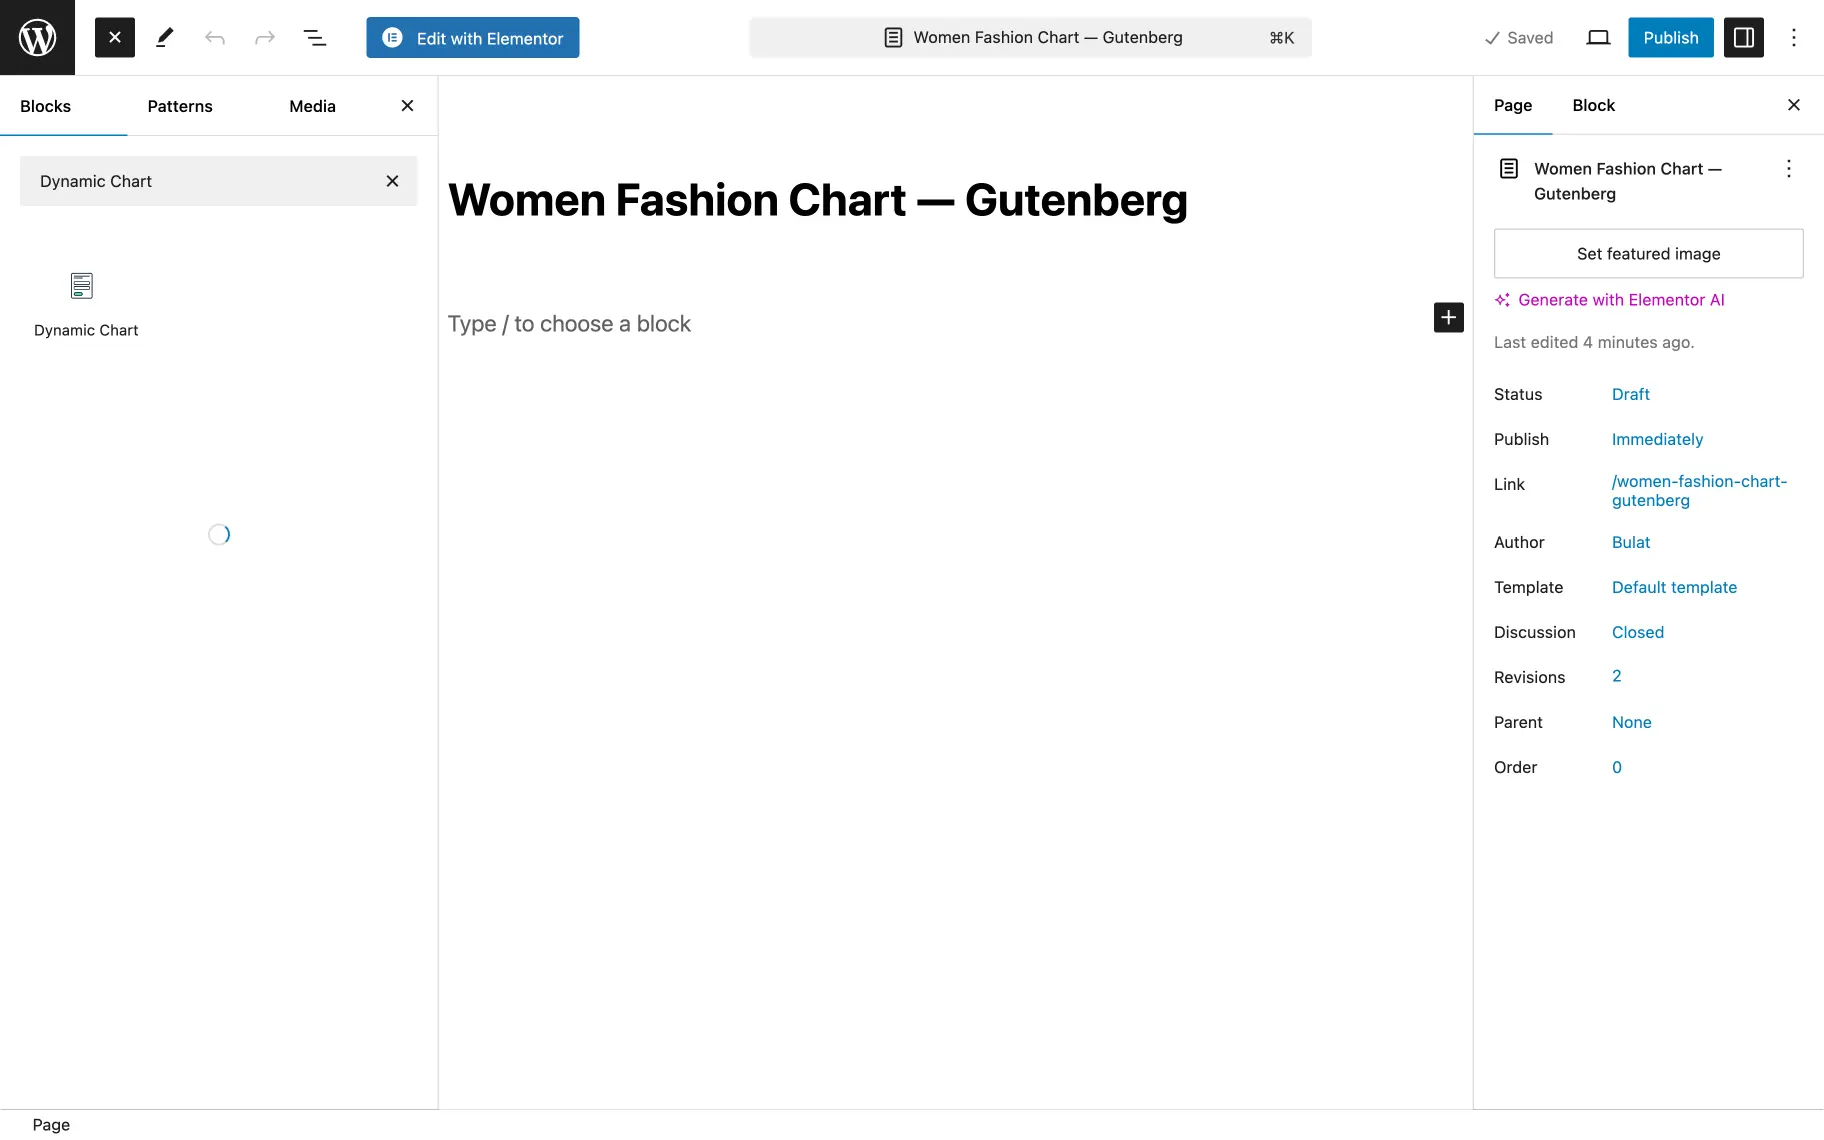
After that, the block can then be added to the selected section for further customization. In the block’s settings, one needs to choose the Chart that was created before.
Let’s take a look at the chart on the front end.
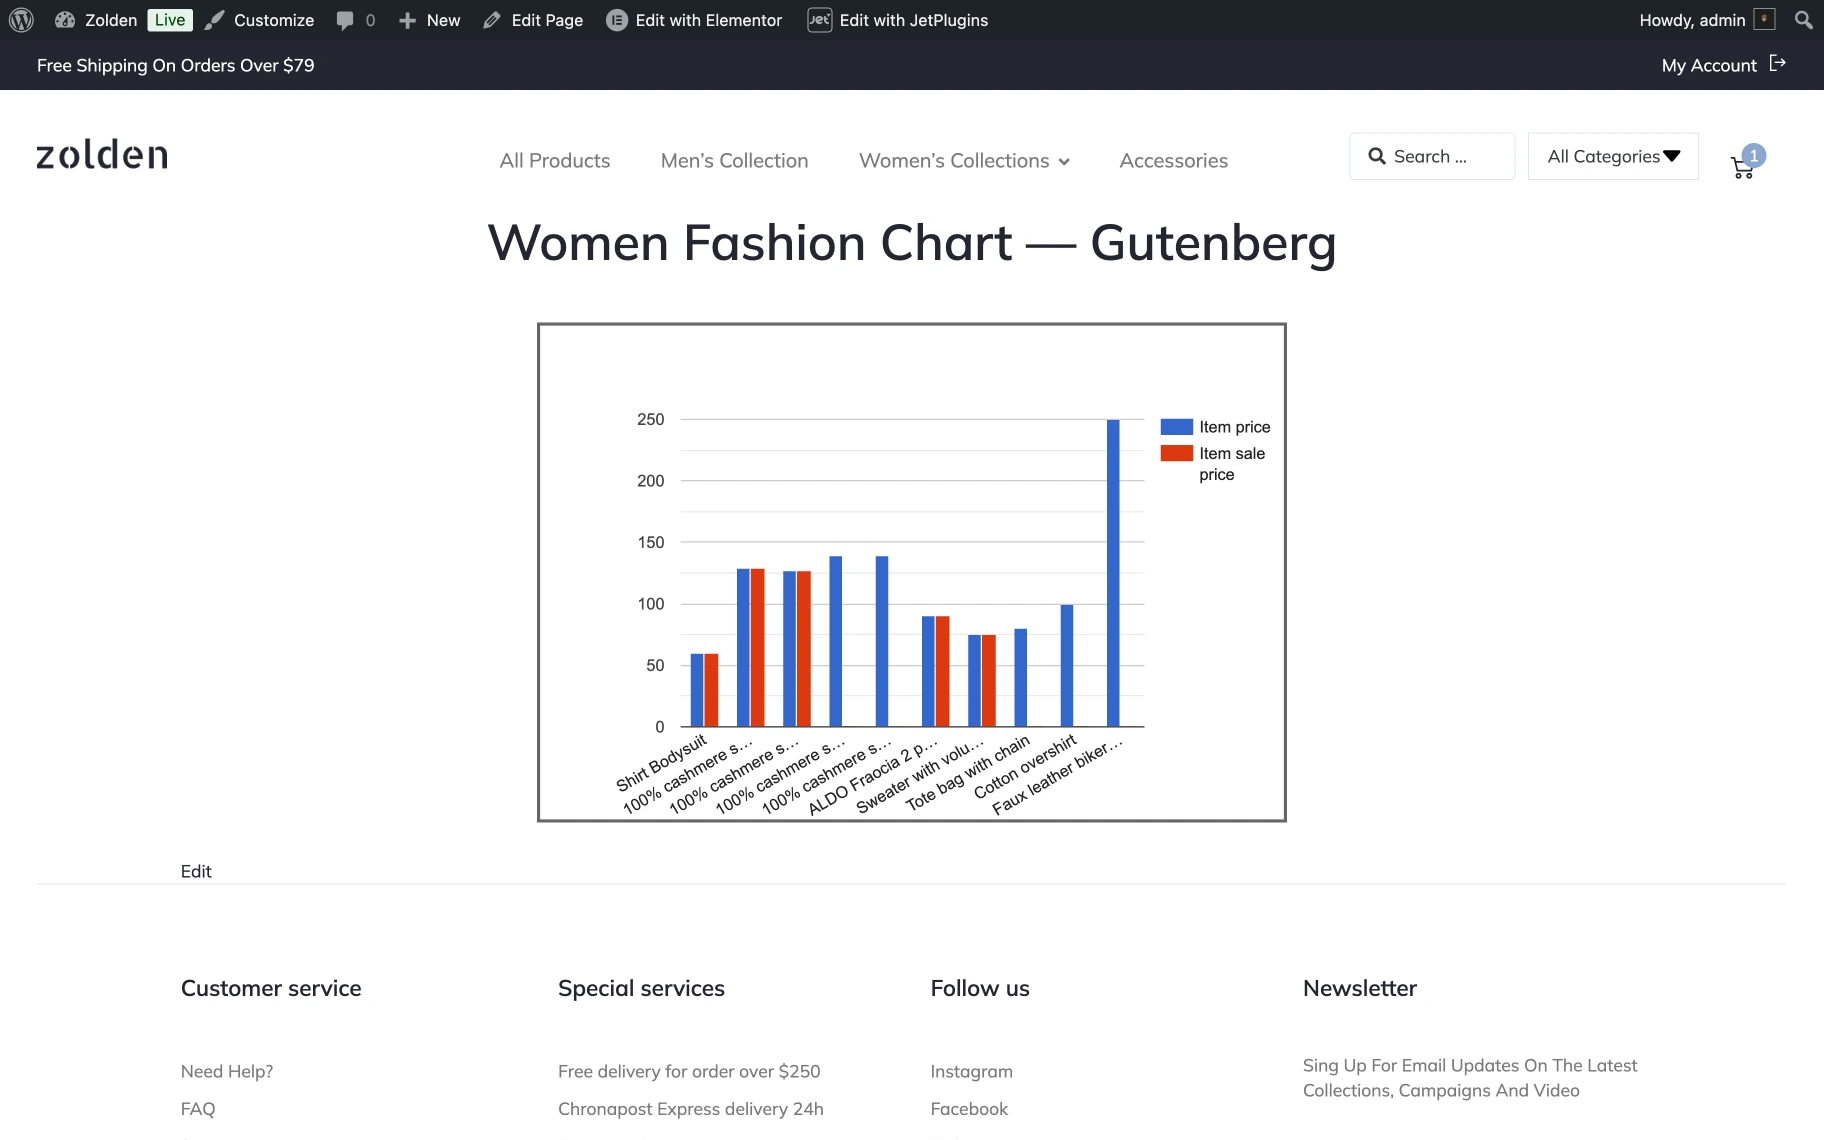
That’s all one needs to know about how to use Charts Builder from the JetEngine plugin to display data on the WordPress website with the help of charts.