How to Use Pie Chart Widget
This tutorial aims to show how to display your statistical data with a JetElements Pie Chart widget as well as its customization for the Elementor editor.
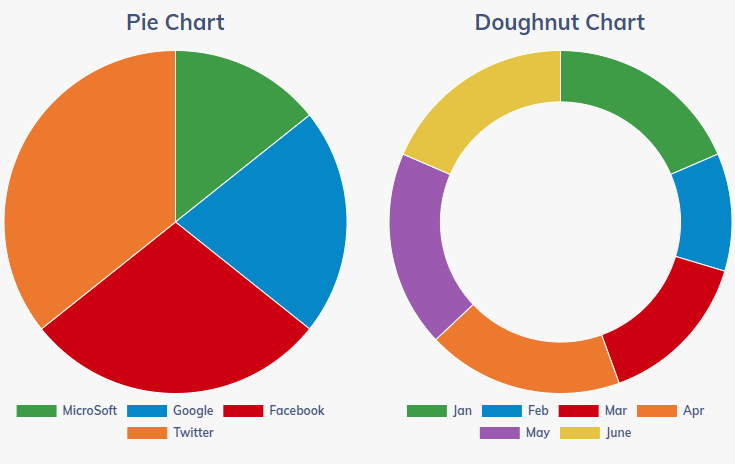
Everyone who owns a business might need to showcase statistics data on his website. It can display the growth of your company and therefore increase the trustworthiness. Pie Chart is a perfect match to showcase your company’s achievements.
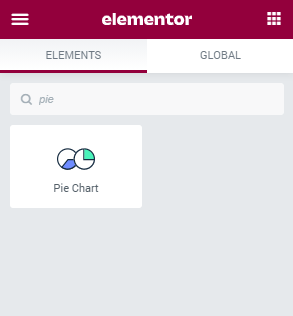
1 Step — Add the Pie Chart to the page
Go to your website’s dashboard and find the page where you would to place s chart. Open it with Elementor page builder and drag and drop the Pie Chart widget to the working area.
2 Step — Add the data and define settings
Every “slice” of the pie chart is added as a separate item. By default, there are three “slices” but you can add more by clicking the “Add Item” button.
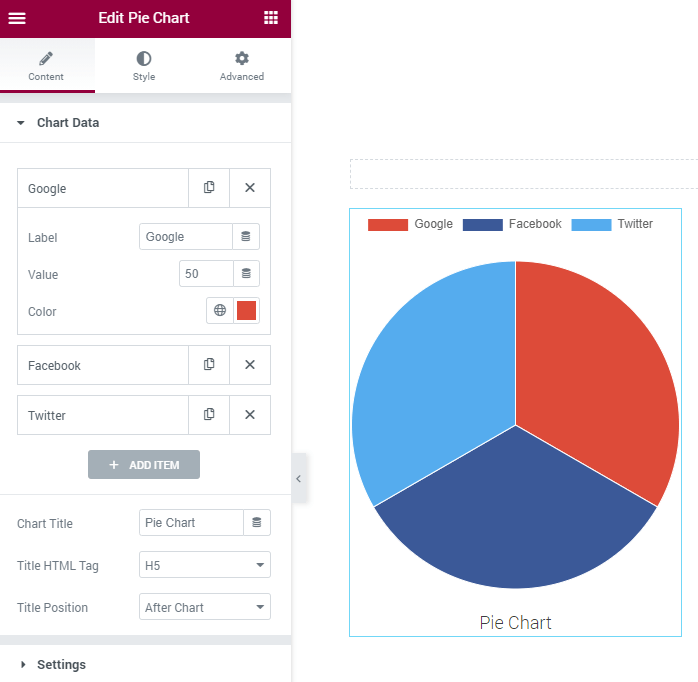
Give a new item a name in the Label area and set its Value. Define the color of the item in the Color option.
After that, proceed to the Chart Title field and type in the title of the whole chart, so that people know what it represents. Move on to the Title HTML Tag and select a tag in the drop-down list. The Title Position drop-down allows you to choose whether you want the title to be displayed above or below the chart.
Now, open the Settings accordion block. let’s go through its features.
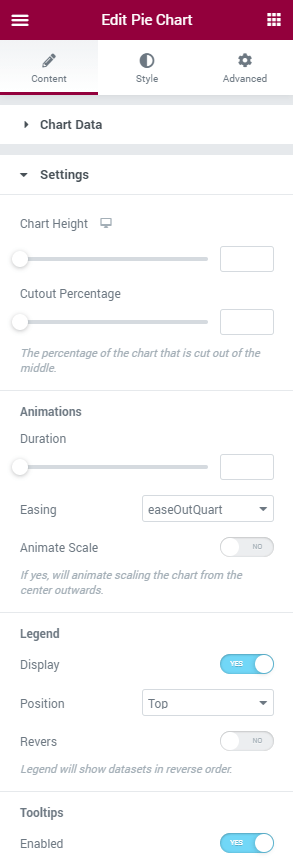
- Firstly, define the Chart Height. Move the slider right or left so that the diameter of the chart increases or decreases respectively;
- If you want your pie chart to become a doughnut chart, go to the Cutout Percentage option and move the slider to the right;
- Pie Chart performs a simple animation when the user first opens it. Go to the Duration option and define how fast the animation will appear. The further to the right you place a slider, the slower the animation becomes;
- In the Easing drop-down, you can select the animation effect which will be applied to the chart;
- If you want your pie chart to scale from the center outward – go to the Animation Scale toggle and turn it on;
- And now let’s have a look at the Legend block. Toggle the Display option to yes if you want the legend to be showcased;
- Define the legend’s position in the Position drop-down list. It can be placed at the top, at the bottom, on the right or to the left of the chart;
- In case you want the legend to be shown in the reverse order, enable the Reverse option.
- At the very bottom, you can find the Tooltip block, where you enable the tooltips which appear once you hover the pointer over the chart.
Now you only have to style the chart up. Open the Style tab where you can utilize all the available options to make the chart stylish and trendy. Afterward, click the “Update” green button at the bottom of the menu to save the changes.
So now you have mastered the Pie Chart widget and can easily create one on our website. Enjoy!