
These days, having a fast-loading website is more important than ever. A slow website can frustrate visitors, causing them to leave your site. Also, your slow site won’t show up in searches as much, so you will get fewer visitors in the first place. Thankfully, tools are available to help you optimize your website’s speed, such as GTmetrix.
In this article, I will explore GTmetrix, how to use it, and how it can help you speed up your website. I will also provide tips and tricks for optimizing your website’s speed and answer some frequently asked questions about website performance.
Table of Contents
What is GTmetrix?
GTmetrix is a website performance testing tool that analyzes your website’s speed and identifies improvement areas. It measures page load time, page size, and the number of requests made to the server to identify areas where website speed can be optimized.
How to Use GTmetrix
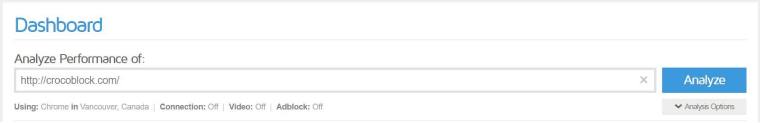
Getting started with GTmetrix is super easy. All you need to do is go to gtmetrix.com and sign up for a free account. Then, you can enter the website URL you want to test.
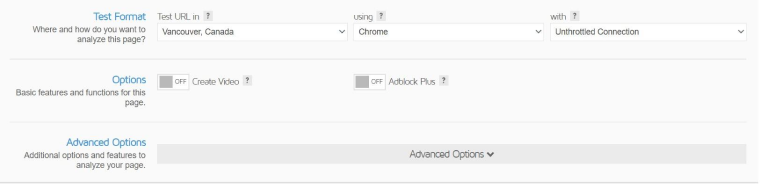
You can click the Analysis Options drop-down arrow for some additional settings. You can specify the test location, web browser, throttled or unthrottled connection, and other settings here. If unsure, you can leave all these settings as they are.
Click Analyze to start the analysis process. Once it has finished, you will see the results page with several information tabs.
But before you explore the tabs, some key figures are presented to you.
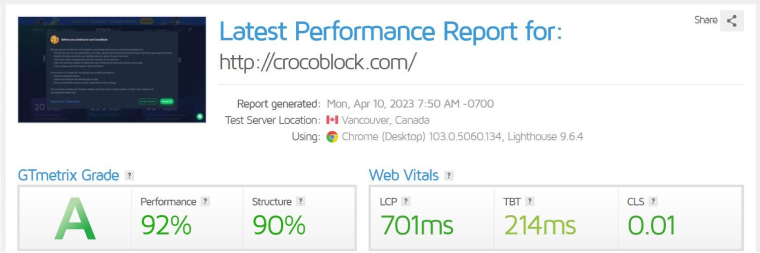
The GTmetrix Grade section shows you the following:
- An overall grade.
- The Performance score measures how well a website performs from a user perspective.
- The Structure score measures how well the page is constructed for optimal performance.
The Web Vitals section provides the most important measurements:
- LCP (Largest Contentful Paint) measures the time it takes for the largest content element on your page to display in the visible part of the web browser.
- TBT (Total Blocking Time) measures the amount of time that scripts block your web page’s loading process.
- CLS (Cumulative Layout Shift) measures the amount of unexpected layout shift that occurs during the loading process of your web page.
Summary
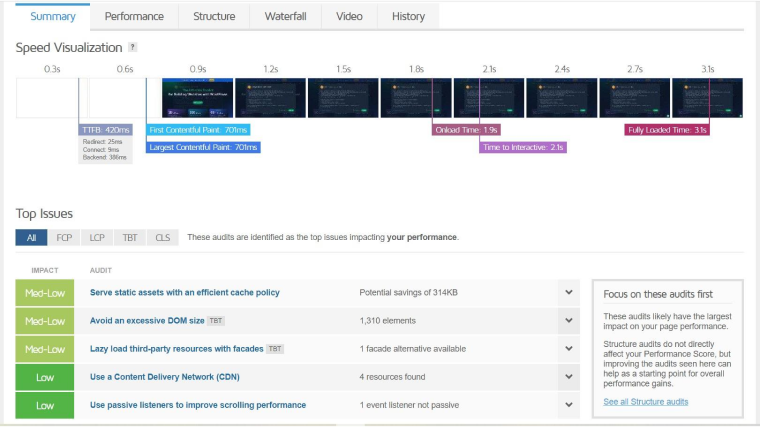
The Summary tab displays a Speed Visualization chart showing when your page’s key parts were loaded. It also lists the top issues.
Performance
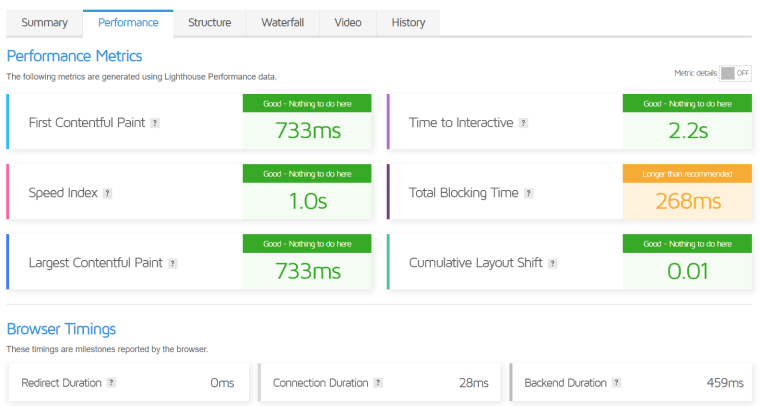
The Performance tab contains figures showing all the important numbers for different aspects of your page’s load time. The Performance Metrics section contains some additional load time figures:
- First Contentful Paint measures the speed at which the first content elements, such as text or images, are displayed on your web page.
- The Time to Interactive metric measures the duration for a website to become fully interactive. It indicates how long it takes for users to interact with the website’s content, such as clicking links or buttons, after the page has started loading.
- The Speed Index metric measures how quickly the content on your website becomes visible to the user.
The Browser Timings section includes:
- Redirect Duration is the time to redirect URLs before loading the final HTML page.
- Connection Duration is the time taken to connect to the server after all redirects to request the page.
- Backend Duration refers to the amount of time it takes for the server to generate the initial response.
- Time to First Byte (TTFB) refers to the total duration from the beginning of the request to receiving the first byte of the response.
- First Paint is the initial point at which the browser starts rendering the page.
- DOM Interactive Time is the point in time when the browser has completed loading and parsing HTML, and the DOM has been constructed.
- The DOM Content Loaded Time is the moment when the DOM is fully prepared and there are no stylesheets that are preventing JavaScript from running.
- Onload Time is the point when all page resources have been downloaded and the page has finished processing.
- Fully Loaded Time is the maximum amount of time after the First Contentful Paint and Onload have occurred, and the network and CPU have been idle for 5.25 seconds each after the last request has been captured.
Structure
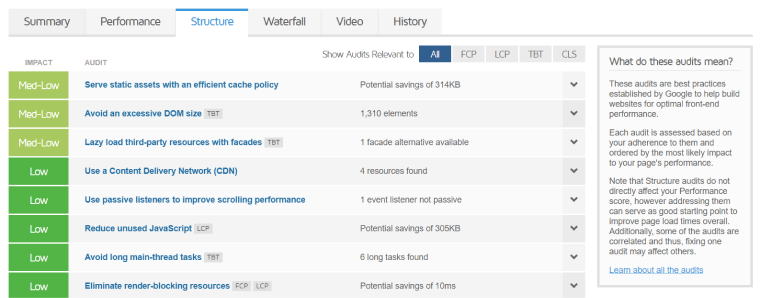
The Structure tab includes evaluations based on Google-established best practices for creating websites with optimal front-end performance. The tab prioritizes audits based on their likely impact on the site’s performance, and while they do not directly affect the Performance score, addressing them can be a good starting point for improving page load times. It’s worth noting that some audits are correlated, so fixing one may also impact others.
Waterfall
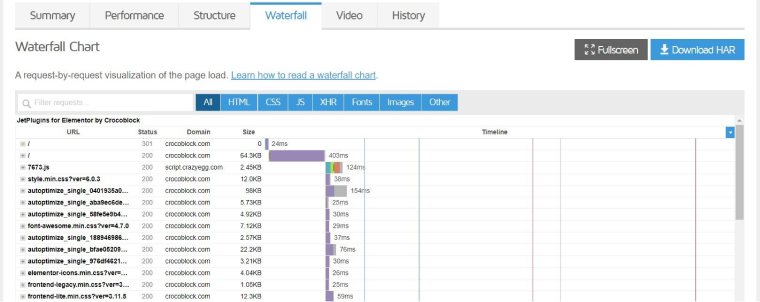
The waterfall chart shows how your website loads, including every script, media file, and requested third-party resource. It displays their request details, duration, and execution times, with varying bar lengths indicating how long each took to request, download, and/or execute. This data can help debug performance and page issues. Although it may seem overwhelming, breaking it down section by section can make it more manageable.
Video
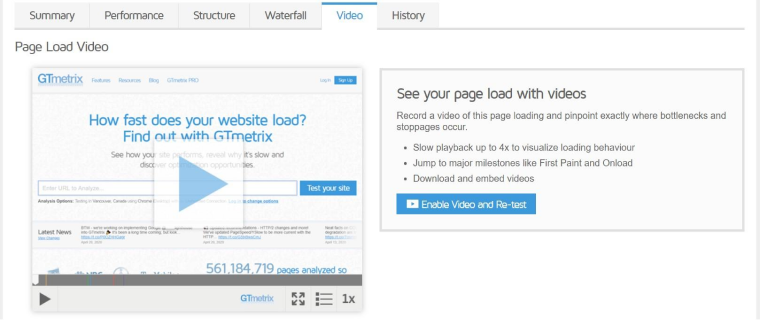
You can record a video of your page loading to identify bottlenecks and stoppages. The video playback can be slowed down up to 4x to visualize loading behavior and jump to major milestones such as First Paint and Onload.
History
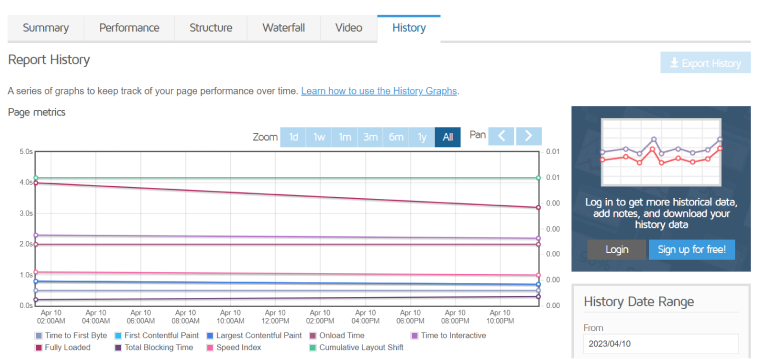
The History tab in GTmetrix is where you can view past reports and access History Graphs to track your website’s performance over time.
How to Speed Up Your WordPress Website
If you have tested your website on GTmetrix and the results are not as good as you hoped, don’t worry. There are actions you can take that can help to speed up the loading of your site.
🛑⚠ CAUTION: Make sure you back up your website before making any changes.
- Update the PHP version. Newer versions of PHP are usually faster than previous versions, so updating your PHP can help improve the performance of your website.
- Update WordPress. If there are updates available for WordPress, your site’s theme, and any of your plugins, be sure to update them.
- Upgrade your hosting. Check with your web host to see if you can get a higher-performance hosting package.
- Optimize images. There are various tools available, either online or as plugins, that allow for the lossless compression of images. This means that images can be compressed without compromising their quality.
- Optimize the database. Over time, your site’s WordPress database can become clogged with lots of unnecessary data. Therefore, you may find that optimizing the database speeds up the loading of your website.
- Optimize CSS, HTML, and scripts. Many WordPress speed optimization plugins automatically optimize CSS, HTML, scripts, images, and the database.
- Use a CDN. Using a Content Delivery Network can help to speed up your website by caching content on servers located around the world, reducing the distance that data needs to travel to reach your visitors.
This is just a quick summary of some of the things you can do to speed up your website. For a more detailed explanation of all recommendations, please see our guide: how to speed up your WordPress website and Crocoblock Plugins.
FAQ
Yes, Google cares about page speed. In fact, website speed is a factor in search engine rankings. A fast-loading website can lead to more traffic from searches, thus improving the site’s visibility.
Yes, GTmetrix is a reliable tool for testing website performance. It provides detailed information about your website’s speed and identifies improvement areas. However, it is essential to note that the results should not be the only metric used to evaluate website performance. Other factors, such as user experience and engagement, should also be considered.
Yes, GTmetrix offers a free account option to access basic performance analysis tools. However, more advanced features like monitoring and API access require a paid subscription.
GTmetrix grades range from A to F. A score of B or above is generally considered good.
Ideally, your website should load in 2-3 seconds. Anything longer than that can result in visitors leaving your site.
A Content Delivery Network (CDN) is a collection of servers located in different parts of the world that store copies of your website’s content. When someone visits your website, they are served content from the server closest to them, reducing the time it takes for your website to load.
Final Thoughts
GTmetrix is a powerful tool that can provide valuable insights into the performance of your website. By identifying areas for improvement, you can make changes to speed up your site and provide your users with a better experience. However, it’s important to remember that website speed is just one factor in overall user satisfaction, so it’s worth considering other factors, such as content quality and design.