
Customer engagement affects profits because an engaged user is more likely to patronize you and become a loyal customer than one who isn’t. Companies that embraced digital customer engagement had a 70 percent increase in revenue than those that didn’t.
You should track engagement metrics to ensure that your website is effectively reaching and retaining visitors. These metrics can help you analyze your website’s performance to drive conversions.
The following article discusses six essential website engagement metrics every WordPress website owner should monitor, whether you’re a marketer, a blogger, or a small business owner.
6 Website Engagement Metrics to Track
Measuring your site engagement metrics will tell you if your content aligns with your users’ interests. In other words, what parts of your website address users’ pain points and which do not maximize conversion rates? Using this information, you can formulate a more effective content marketing strategy to increase your website’s traffic.
Here are some web engagement metrics to track on your WordPress site.
Bounce Rate
Bounce rate is the number of visitors who land on your page but leave without interacting or performing other actions like exploring other pages. For instance, if visitors looking for information, specific products, or services can’t find them, they’ll leave, increasing your bounce rate.
Search engines like Google analyze bounce rates to determine whether your page offers relevant content to visitors, which affects your SEO. A high bounce rate may also indicate site performance issues, such as slow page loading times, poor design, and usability.
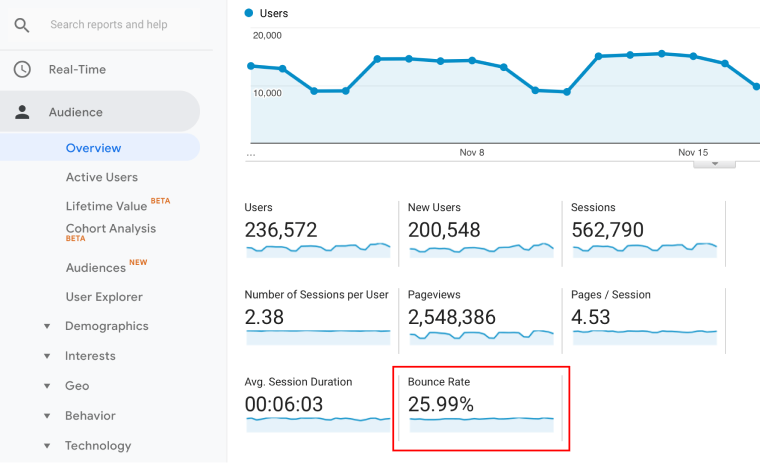
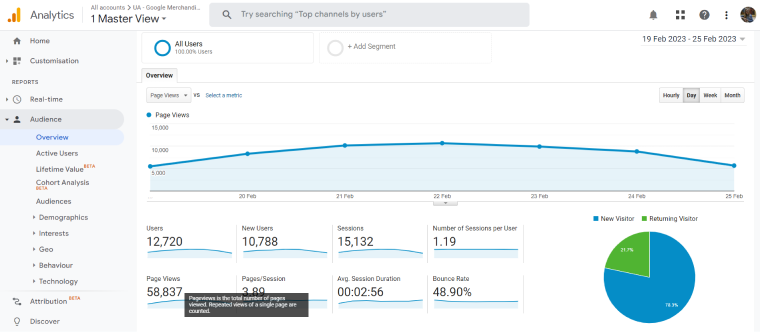
You can measure your site’s bounce rate on Google Analytics using these steps:
- Log in. Go to “All Website Data” at the top left corner of the page, and click it.
- Tap “Audience > Overview” in the side menu on the left.
- Under “Overview”, you’ll see the bounce rate with other metrics.
If you want to see the bounce rate of individual pages, go to “Behaviour”, under “Site Content,” click “All pages”.
To see the bounce rate by time period, change the date range from the top right-hand corner, as seen below.
NOTE:
In this article, I’ve used Google Universal Analytics demo account. But, Google has a new version of Google Analytics called Google Analytics 4 (GA4).
While there are subtle differences between the two, the major one is that Google Analytics 4 supports full reporting across all devices and platforms. It allows you to track users’ interaction with your app or website. However, come July 1, 2023, Google will be moving on from Universal Analytics.
You can lower bounce rates by creating relevant content, increasing user engagement with videos, and improving site performance issues, user interface, and design.
Time On Site
Time on site, also known as average session duration, is the average time users spend from when they get to your page to when they leave it. This user engagement metric shows you how valuable visitors find your entire website. It also tells you how long visitors shop before buying products from your website.
There are ways you can ensure your visitors stay longer on your site.
For instance, if you’re running an online store, you can use an eCommerce marketing tool to create a popup. In the popup, give your website visitors an irresistible offer like a discount. Then customize the popup to appear when your website visitor intends to leave your page. Your visitors are more likely to avail of the irresistible offer, increasing site time.
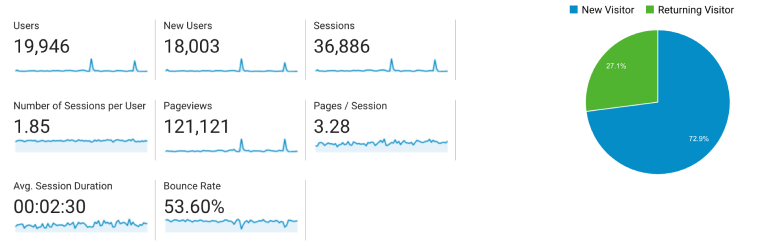
You can also increase time on-site with interactive content like quizzes and calculators. To track the average session duration on Google Analytics:
- Go to “Audience”;
- click “Overview”.
You see the average session duration alongside metrics like bounce rate and pages/sessions.
Google Analytics determines this metric by dividing the entire duration of all sessions during a specific time frame by the total number of sessions during that time frame.
For example, let’s say you have three website visitors in one week:
- Visitor 1 spent 200 seconds on your website.
- Visitor 2 spent 100 seconds.
- Visitor 3 spent 90 seconds.
After adding the duration of each session, which is; 390, it divides by 3 to get the average session duration metric of 130 seconds.
To increase your session metric, improve your internal linking strategy to retain and engage your target audience.
Pages Per Session
Pages per session show the average number of pages a user has browsed. If you have an eCommerce site, you want users to check out as many products as possible before purchasing.
High pages per session indicate that users find your content persuasive and exciting. This metric is also helpful in knowing which pages lead visitors deeper into the website. Furthermore, it can reveal problems with internal linking and conversion rates.
To track pages per session on Google Analytics, select “Acquisition” and “Overview”.
Analytics tools like this calculate pages per session by dividing the number of page views by the total number of sessions.
A great way to increase your pages per session is to improve your content cluster strategy and make navigating those pages with relevant internal links easy. Ensure you also include other related content to enhance their user experience and customer journey.
Click-Through Rate (CTR)
Click-through rate (CTR) measures the percentage of people that click on your link or call-to-action.
You can use this helpful metric to assess your ads and keywords’ performance. You’ll want a high CTR if you have a content site, mainly if you rely on ads or affiliate revenue. CTR also affects your SERP ad ranking; the top position goes to the highest-ranking ad. That’s why tracking your Click-through rate and improving it is vital.
Google search console helps you analyze clicks from Google searches to improve traffic from SERPs.
To track your CTR on Google Search Console:
- Log in to your Gmail account, then sign up for Search Console;
- when signing up, it will ask you for your domain or URL prefix.
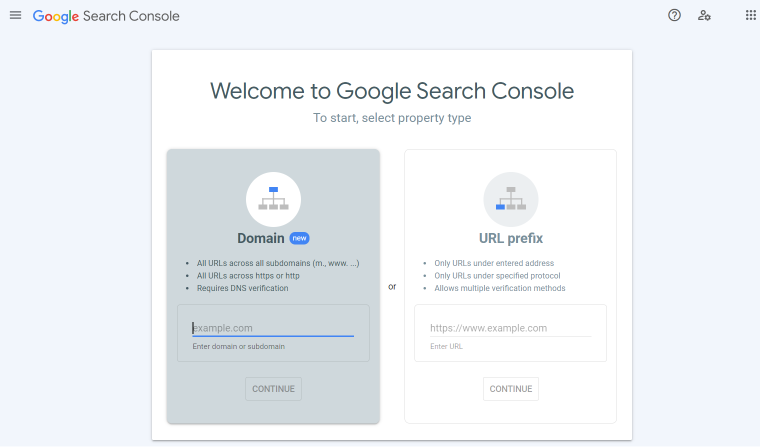
Google will ask you to download and upload a file they provide on your website. Confirm the upload, and they’ll verify your ownership. After this, you’ll need to confirm that you own the website.
Click “Search Results” on the left-hand sidebar to find the CTR. A chart with impressions, total clicks, average CTR, and average position will appear.
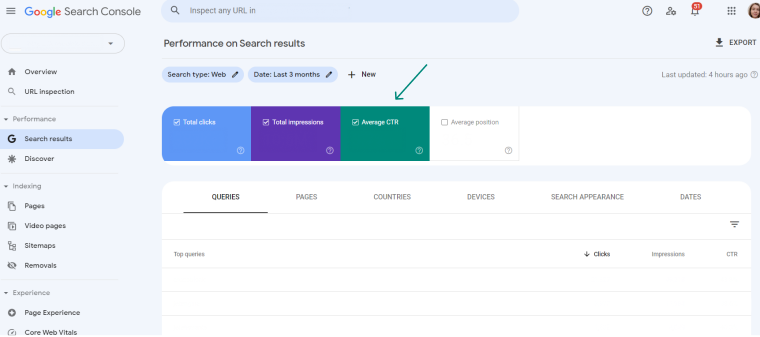
CTR is calculated by dividing the total number of clicks your links received by the total number of times the Google network displayed them (impressions). In this report, the search queries and CTRs are sorted based on the popularity of the searches.
Using SEO software (like Surfer SEO), create titles and meta descriptions for your content to encourage users to click through. Your primary keywords should have a click-through rate of more than 10 – 20 percent. If you want to increase your CTR, set goals for each search term.
Furthermore, choosing domain names with keywords will also increase your site’s visibility and boost organic search traffic.
Page Views
Page views calculate the total number of times users view pages on your site. This metric is mainly about assessing user behavior on your website. Tracking this metric shows you where people are coming from, what pages they’re viewing, and what time they visit, among other data.
To track page views:
- Go to “Audience” then click “Overview”;
- click “Page Views” and you’ll see a page like this example below.
Google calculates the page views by dividing the total number of page views by the total number of visits during the same timeframe. This user engagement metric helps you see the pages that drive traffic, user engagement, and conversions.
To increase your page views, build an email list to retarget your customers by emailing them. Offer them deals on products related to a previous purchase. This way, they’ll be tempted to check it out on your page.
Conversion Rate
Conversion happens when your website visitor takes an action you desire. Understand what you’re trying to measure to calculate your conversion rate metric. Establishing goals, you can evaluate with quantifiable metrics will help you do this.
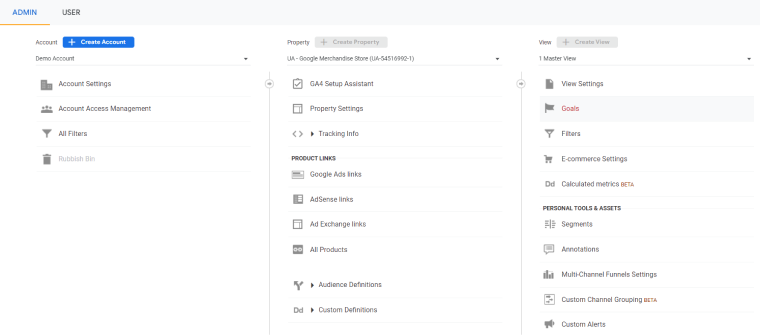
Once you know what you want to achieve, go to Google Analytics to set your goals. Here’s how:
After you log in, click on the cog Icon in the bottom left corner to go to Admin settings.
Then click “Goals” on the right like the image below:
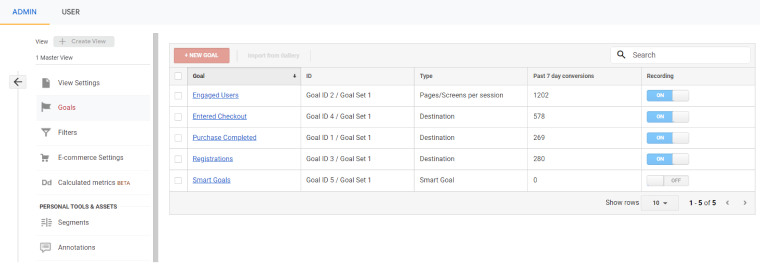
After clicking “Goals”, it takes you to a page where you can make your goals. There are three steps; Goal Setup, Goal Description, and Goal Details.
After setting up your goals, give Google Analytics some days to gather data. You can find the conversion rates data in the right menu after you log in:
- Click “Conversions“;
- go to “Goals”;
- then click “Overview”.
To calculate your website’s conversion rate, divide the goals achieved by the total visitors multiplied by 100.
To increase your conversion rate, ensure you meet your audience’s expectations. If a visitor clicks your search engine ad or meta description, ensure the content delivers on promises you made in your copy.
FAQ
Top engagement metrics include Time on site or page, Bounce rate, Pages per session, Click-through rate (CTR), and Conversion rate. The metrics above can help you measure the engagement of your website, content, or product’s engagement and identify areas that need improvement. Despite this, the engagement metrics that are most important for your business will depend on your specific objectives and goals.
The three most important are organic traffic, bounce rates, and conversion rates.
You can measure website engagement by monitoring how long visitors stay on your site, how many pages they visit, and their return rate. Tracking social shares matters too.
Final Words
Website engagement metrics show your user engagement performance; the results are actionable. The insights from these metrics can help you optimize your site’s user experience and boost your marketing strategies.
To achieve the best results, focus on creating content your audience wants with clear call-to-actions. This will help you increase conversions and sales.


