Website speed has become a critical factor in shaping user satisfaction, engagement, and even search engine rankings. As websites strive to deliver content at the speed of thought, understanding and optimizing key performance metrics have become paramount. In this article, I will unravel the world of website speed performance metrics, exploring the nuances of each and how they contribute to a seamless user experience and the way search engines rank it.
Table of Contents
- Why Are Website Performance Metrics Important?
- Google Core Web Vitals
- How to Measure the Website Loading Speed and Performance?
- FAQ
- Bottom Line
Why Are Website Performance Metrics Important?
But let’s start from the beginning and clearly understand why we even need all these metrics and what they can bring to the table.
In short, they give insights about the things to be improved to make the project more attractive to users and, therefore, more successful. And the way most of the measurement tools give these insights is pretty clear and efficient, helping to detect the particular pain points of the website.
Let’s dive deeper into this topic and highlight the main reasons why website speed performance metrics are worth our attention.
User experience.
Actually, this is the factor Google has built its Core Web Vitals around. They are designed to display the intended user’s experience in the form of data. Metrics such as First Contentful Paint (FCP), Largest Contentful Paint (LCP), and Cumulative Layout Shift (CLS) offer insights into how quickly content loads and how visually stable the website is. By analyzing these metrics, website developers can enhance the user experience, ensuring that visitors have a smooth and enjoyable interaction with the site.
Conversion rate.
Let’s assume the previous step was successful, and the user is happy with the website and its content. Now, it’s time to convert users into clients.
Monitoring user interactions through metrics like Time to Interactive (TTI) and First Input Delay (FID) provides insights into how quickly users can interact with the website. A faster and more responsive website contributes to higher user engagement and can positively impact conversion rates, be it making a purchase or filling out a form.
Technical performance.
So, the user is interacting with the site, and that’s great. But will it be able to handle all these clicks, filters, and requests?
Metrics like Total Page Size and Number of HTTP Requests shed light on the technical aspects of a website’s performance. Monitoring these metrics helps identify opportunities for optimization, such as reducing page size, minimizing HTTP requests, and implementing content delivery network (CDN) strategies. This optimization, in turn, contributes to faster load times and improved overall performance.
Search engine ranking.
After all these successful interactions, if Google sees that your website is running like clockwork, why not recommend it to more users?
This is where metrics like Time to First Byte (TTFB) and Speed Index come into play to directly influence a website’s performance in search engine algorithms because speed and user experience are key factors in determining search rankings.
There are more factors to consider, such as content, UX, and, as a result, the thing that Google calls internal behavioral factors. Bounce rate, session duration, and depth, time on a page and scroll, conversions, and others are taken into account as well. Google doesn’t joke around when it comes to this topic – they actually patented the way it takes behavioral factors into account, and you might want to have a look at the images there.
As a website owner, you can track such factors using Google Analytics, the performance tab. Click-Through Rate (CTR) plays a vital role here, and, according to specialists from Backlinko, increasing them by 10% will double your traffic.
Google Core Web Vitals
In 2021, Google introduced Core Web Vitals, the metrics considered crucial for a proper user experience.
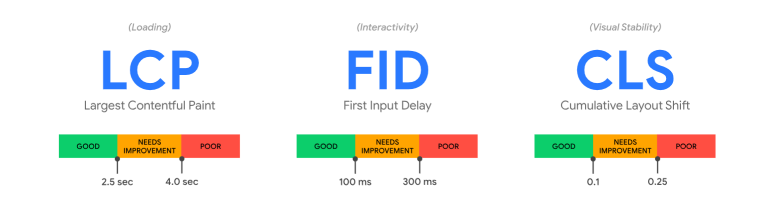
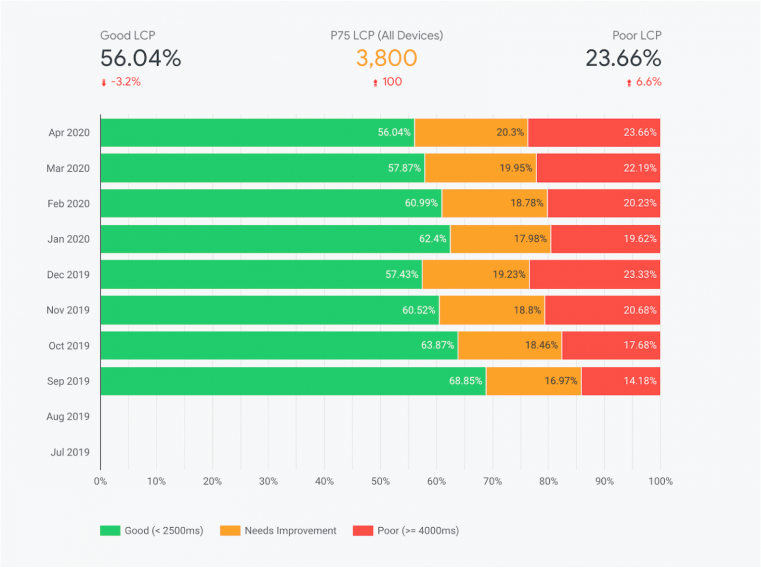
- Largest Contentful Paint (LCP), aka loading performance: LCP shows how much time it takes to render the largest image or text block visible within the viewport. Good user experience means that LCP occurs within 2.5 seconds of when the page first starts loading.
- First Input Delay (FID), aka interactivity: FID measures the time from the user’s first interaction with a page (like tapping a link) when the browser begins processing in response to that interaction. The FID should be less than 100 milliseconds.
- Cumulative Layout Shift (CLS), aka visual stability: CLS shows off the number of unexpected layout shifts during the entire lifespan of the webpage. In simple words, it calculates all situations when suddenly, without effort or warnings, something changes on the page. It also calculates the conditions presented when you want to click the button, but it suddenly moves, and you’re clicking something else. Pages should maintain a CLS of less than 0.1.
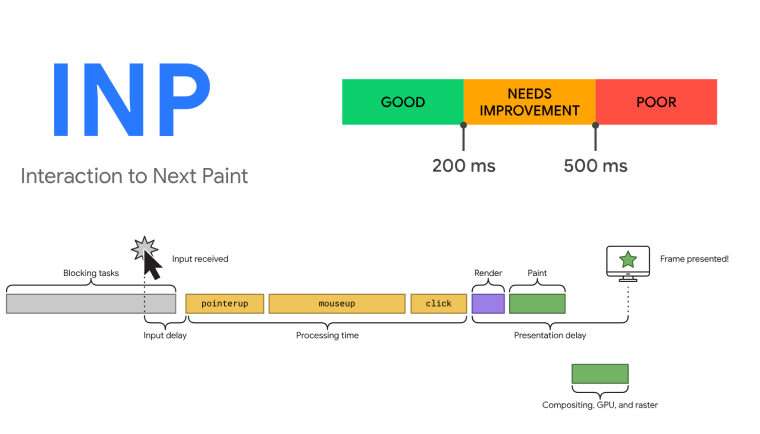
FID will be replaced by the new metric called Interaction to Next Paint (INP) in March 2024. In the most basic terms, it shows whether the interactive elements work properly and are not blocked by some long tasks.
How to Measure the Website Loading Speed and Performance?
Besides the new tool, all of Google’s major web developers’ tools now support Core Web Vitals. Actually, most of them are based on Lighthouse technology: PageSpeed Insights, Lighthouse extension, the comparatively newly launched Chrome UX Report API, GTmetrix, and others. These can be used in tandem to measure a website’s loading speed.
Lighthouse
Lighthouse is an open-source auditing tool for improving the quality of websites and web apps. It includes performance, accessibility, SEO, Progressive Web Apps, and the best practices audits that you can run on any web page. As I’ve already mentioned, it’s the basis of most of the tools with web interfaces, and developers can use its API to create their own solutions.
The most popular tool based on Lighthouse is Google PageSpeed Insights. However, it’s available directly in Chrome’s DevTools (the right tab) but should be performed in incognito mode because extensions running in normal mode affect the results. This version of Lighthouse is very useful for testing sites on localhost.
Google PageSpeed Insights
PageSpeed Insights is a tool with a handy UI that measures page load speed. It analyzes the web page, displays the result on a 100-point scale, and recommends improvements.
The tool shows results for mobile and desktop devices according to the following parameters:
- First Contentful Paint (FCP)
- Largest Contentful Paint (LCP)
- First Input Delay (FID)
- Cumulative Layout Shift (CLS)
- Speed Index
- Total Blocking Time
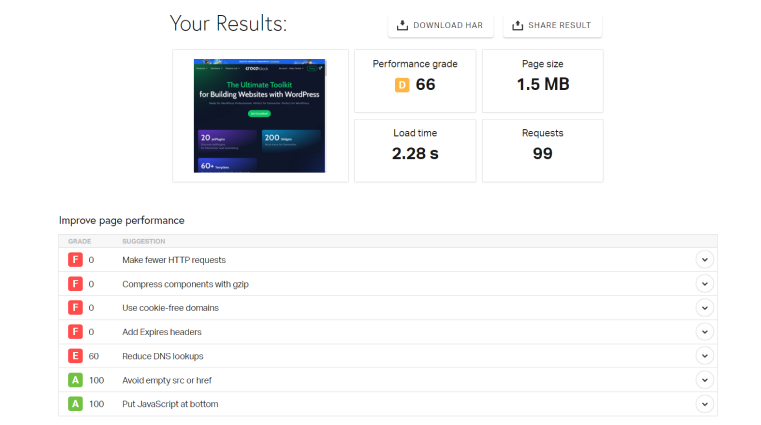
And this is what the recommendations look like:
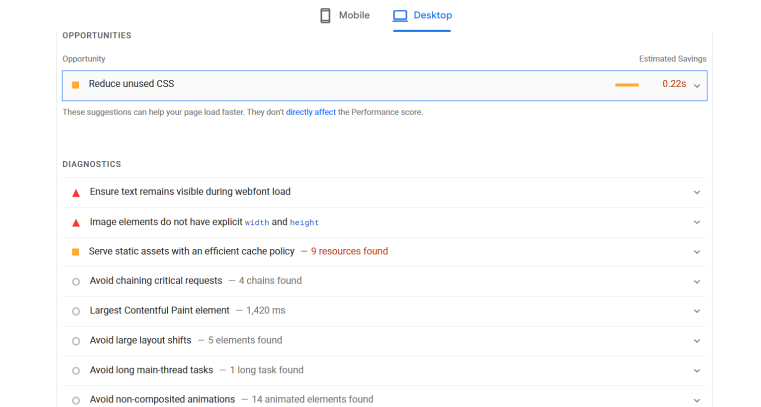
Please do not hastily follow all the service’s recommendations. Get the links and hints it gives, but act smartly.
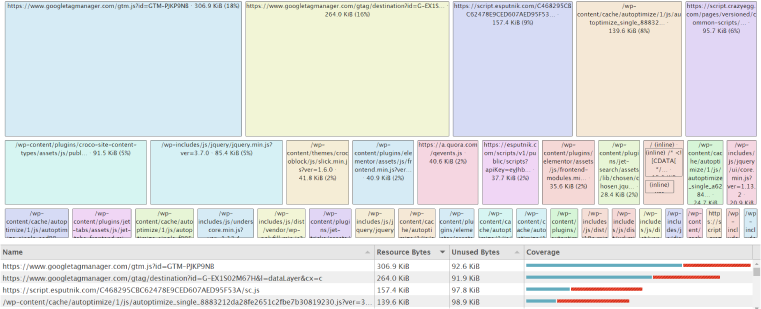
The great asset here is a Treemap (click the “View Treemap” button located over the rendered screenshots); it gives a handy and visual overview of all the scripts running and their sizes. By the way, it can be useful for checking whether certain WordPress plugins load heavy libraries.
Chrome UX Report API
CrUX, often known as the Chrome UX Report API, is a bunch of public data on the real user experiences of millions of websites. It is the actual data collected from real users in the field, not hypothetical lab data. As was previously said, it includes all the Core Web Vitals metrics, as well as metrics like Time to First Byte (TTFB) and First Contentful Paint (FCP).
CrUX is fully integrated into the abovementioned PageSpeed Insights but can also be used via CrUX Dashboard, BigQuery, or CrUX API, which enables high-level data integration with other apps.
Pingdom Website Speed Test
This tool was developed specifically for measuring the website load speed. It identifies whether the webpage is fast enough, too slow, too heavy, etc. It combines a super-easy user interface suitable for every novice with features advanced enough to satisfy experienced developers. Most importantly, this tool is efficient in helping you make your website fast.
It’s not based on Lighthouse and doesn’t take Core Web Vitals into account, but it measures load speed.
Pingdom Website Speed Test is conducting tests from seven different locations:
- Asia – Japan – Tokyo
- Europe – Germany – Frankfurt
- Europe – United Kingdom – London
- North America – USA – Washington D.C.
- North America – USA – San Francisco
- Pacific – Australia – Sydney
- South America – Brazil – São Paulo
Google Analytics
Good old GA is another convenient way to measure website load speed. However, the data you will receive will differ from the one you will get via PageSpeed Insights or others. And here’s why:
- GA provides data from actual site users that you can segment by location, mobile/desktop categories, and others.
- This data helps you compare the impact of the page load speed on users’ behavior.
- GA numbers are not sufficient by themselves. But with their help, you can track changes in performance. For example, if page speed drops, you can easily check if there was an effect on your marketing metrics (sales, bounce, etc.).
Google also has other tools that will help you measure your website’s performance and load speed, for example, GTmetrix, powered by Lighthouse or Search Console.
You can achieve the most optimal performance possible by using the right combination of the data you get with these tools and their recommendations. Good performance is also a crucial factor not only for a good user experience but also for SEO.
📚 Read also: How to Add Google Analytics to WordPress?
FAQ
No, the PageSpeed score is all about user experience and Core Web Vitals, while loading speed is… well, a loading speed. A good score doesn’t always mean that the website is fast and vice versa.
A score above 90 is considered good, and under 50 is poor. Also, you should check the scores for both desktop and mobile; they almost always differ.
The testing tools mentioned above always give insights and point out what causes bottlenecks and, as a result, bad performance. When it comes to WordPress, it’s very important to use plugins, themes, and custom code wisely, understanding that they might slow each other down. Fast hosting and caching plugins are extremely important, but the essential thing here is understanding what you are doing. If not, consider hiring a performance specialist.
Bottom Line
Website optimization can sometimes be a nightmare, especially if you are not the person who initially developed the website, and have to spend a lot of time figuring out all the hidden culprits. However, the tools available today are really helpful, not only showing the scores but also the things that cause problems.
In this article, we talked about website performance metrics and why they matter, Core Web Vitals, and tools to measure them. Google offers a wealth of insights, and there are plenty of nifty tools available. So, for those keen on grasping the intricacies, all the necessary information is right at your fingertips.