Comparison tables are a game-changer when it comes to online decision-making. They don’t just present data—they simplify its rendition, highlight the key differences, and empower users to make confident choices. Whether you’re stacking up features, prices, or product specifications, a killer comparison table turns indecision into action.
For businesses, comparison tables are a secret weapon that guides users toward the best choice, establishes credibility through clean and logical layouts, and ultimately drives those all-important conversions.
If you’re using WordPress, creating comparison tables is a breeze with the right plugins. From pricing grids for SaaS to detailed product comparisons for eCommerce, these tools make it easy to design tables that perform.
In this guide, I’ll cover the essential types of comparison tables, offer expert tips for crafting them, and highlight the best plugins to get the job done. Let’s dive in!
Table of Contents
- 4 Most-Wanted Types of Comparison Tables
- Best Practices for Comparison Tables
- 5 Popular Comparison Table Plugins for WordPress
- FAQ
- Conclusion
4 Most-Wanted Types of Comparison Tables
WordPress comparison tables come in all shapes and sizes, each tailored to a specific purpose. Whether you’re highlighting features, comparing products, or stacking up pricing plans, the structure of your table can make or break the user experience. Here’s a closer look at the main types of comparison tables and why they matter.
Feature comparison tables: spotlight what matters most
When users are deciding between products or services, features are often the deal-breaker. These tables focus on laying out the nitty-gritty details side by side, letting users instantly see who offers what. Think of SaaS tools or streaming services comparing functionality like “Offline Mode,” “Unlimited Downloads,” or “Free Trial Availability.”
Product comparison tables: the eCommerce MVP
Shopping online often means comparing specs, prices, and benefits across similar items. Product comparison WordPress tables make it happen, which especially benefits the electronics, fashion, and furniture industries alike. These tables often combine visuals—e.g., product thumbnails—with key specs and a bold CTA button to seal the deal.
Pricing comparison tables: a subscription deal-closer
When it comes to services, pricing tables do the heavy lifting. They compare subscription tiers, highlighting key differences like features, limitations, and benefits. A strong pricing table doesn’t just present the numbers; it subtly directs users to the most profitable choice, whether it’s the “Best Value” or “Most Popular” plan.
Specification comparison tables: engineered for tech lovers
If your audience is all about the details, specification tables are your best friend. These are perfect for comparing electronics like laptops, smartphones, or cameras. They focus on specs like “Processor Type,” “Battery Life,” or “Resolution,” ensuring users have everything they need to make an informed choice.
Best Practices for Comparison Tables
Creating comparison tables isn’t just about piling up data. It’s about structuring it in a way that speaks directly to your audience. Here are the guidelines to stick to when crafting tables that truly stand out, backed by some real-world examples.
1. Highlight functionality
Feature comparison tables excel at presenting tool/service distinctions in a structured, visual way. They use elements like color-coded checkmarks and bold icons to quickly communicate which features are included and which are not, ensuring users can assess options at a glance without sifting through lengthy descriptions.
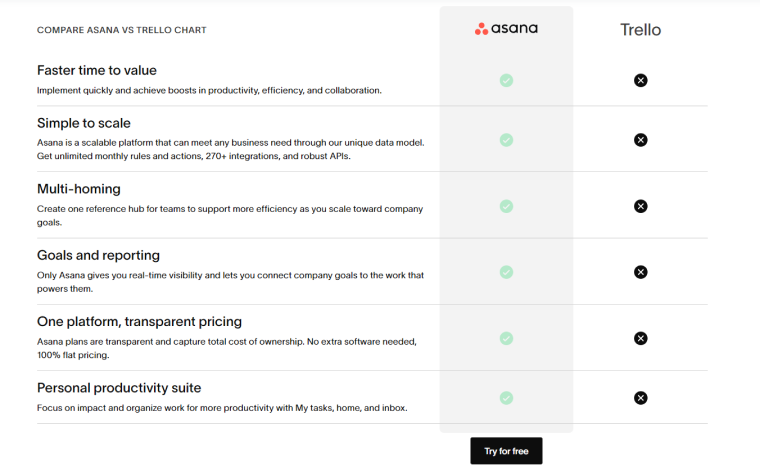
Asana’s comparison table against Trello exemplifies this. Features like “Custom Workflows” and “Advanced Reporting” are clearly marked with checkmarks for Asana, while Trello’s columns are left blank. This isn’t just about listing capabilities—it’s about strategically directing attention. If you’re a user comparing tools, the missing marks on Trello’s side make the gaps impossible to ignore. It’s efficient, user-friendly, and leaves a lasting impression without overwhelming the viewer.
2. Visuals are everything
Product comparison tables shine when including self-explanatory visuals. Pairing sharp, high-quality images with key specifications like size, materials, dimensions, etc., makes the data bulks more approachable. Thumbnails and icons aren’t just eye candy—they’re essential for breaking down information into something that feels intuitive and easy to digest.
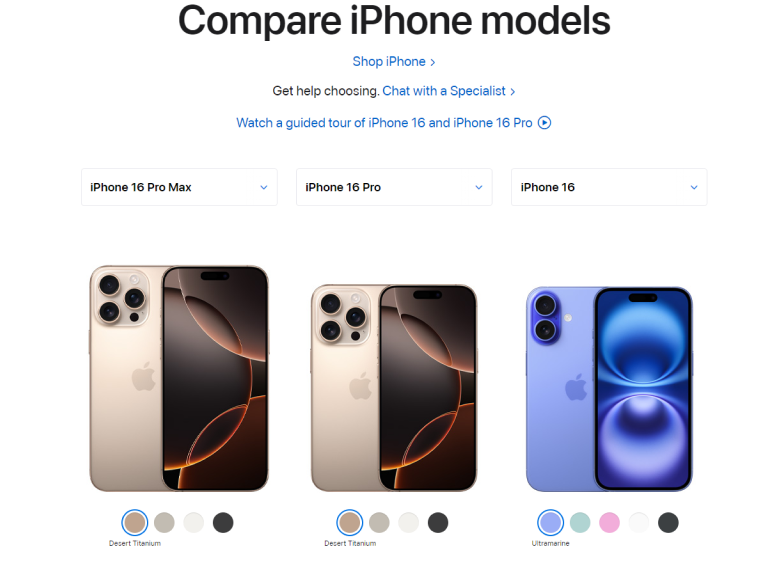
Apple’s iPhone comparison table nails this approach. Each model sits next to a sleek image, paired with straightforward specs like screen size, battery life, and camera quality. Users can instantly spot what sets one apart from another without switching tabs or overthinking it. It’s clean, efficient, and proof that good visuals can make tough decisions feel effortless.
3. Clear and persuasive design
A well-designed pricing table isn’t just informative; it’s persuasive. It highlights the best option without overwhelming users. Techniques like a “Best Value” badge, a distinct color scheme, or a larger card size draw subtle attention to the ideal plan. The right design not only simplifies choices but also builds trust by keeping the layout transparent and easy to navigate.
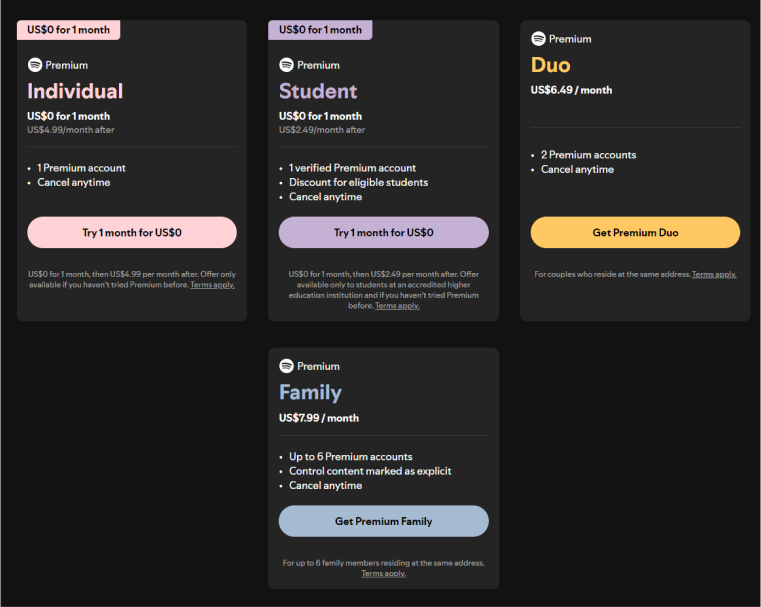
Spotify’s Premium pricing table is a great example. The “Family Plan” stands out because of its larger size, which naturally draws focus, but it doesn’t stop there. Key features—like the number of accounts and cost-per-user savings—are clearly outlined, making it easy for users to evaluate the benefits. Its visual hierarchy combines structured text, whitespace, and distinct typography to ensure the comparison feels intuitive. The design isn’t just visually appealing—it’s a functional tool that guides decisions logically.
4. Ensure precision for technical audiences
Specification tables aren’t about flashy visuals or soft nudges. They’re built for users who want the numbers, the details, and the cold, hard facts. But here’s the trick: if the data isn’t organized logically, even the most tech-savvy user will get lost. That’s where grouping and expandable categories save the day.
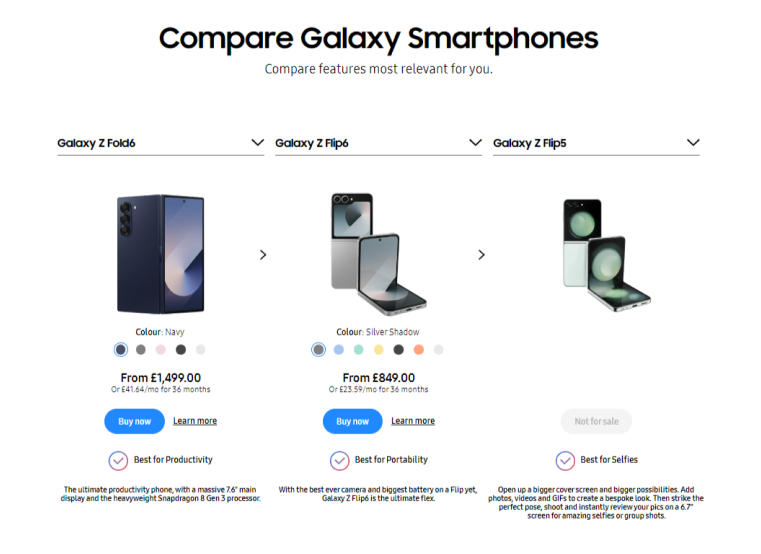
Take Samsung’s Galaxy comparison table. Instead of overwhelming users with a wall of numbers, it organizes specs like battery life, camera features, and performance metrics into collapsible sections. You can skim the basics or dive deep into the details without feeling overloaded. It’s clean, intuitive, and designed to cater to casual browsers and hardcore techies alike.
5 Popular Comparison Table Plugins for WordPress
JetProductTables (Premium)
🏆 Best for WooCommerce stores looking to turn product lists into dynamic, user-friendly shopping experiences.
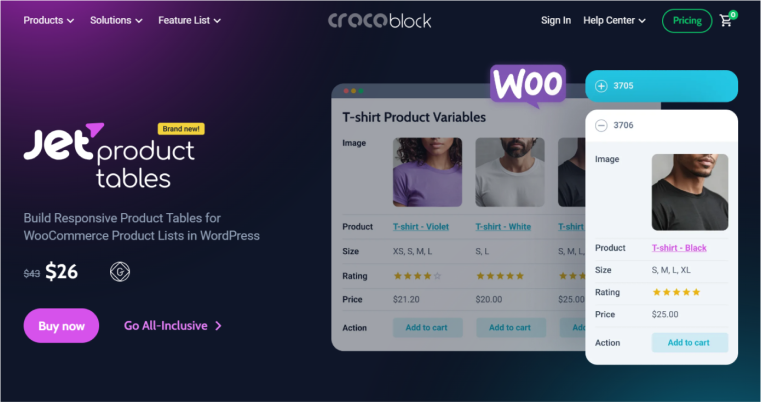
Meet JetProductTables, a plugin that takes WooCommerce product lists and presents them customly. If your product range feels overwhelming, this tool turns those endless lists into clear-cut tables, which your customers can browse with ease.
What makes JetProductTables stand out is its real-time filtering and sorting features. Shoppers can narrow down products by taxonomy terms and attributes, giving them a more focused and stress-free browsing experience. Plus, the plugin syncs directly with WooCommerce, so table data stays up to date without any extra work on your end.
JetProductTables is not just about looks; it caters to stores that want both functionality and speed. Whether you’re showcasing product variations or building mobile-friendly layouts, this plugin helps you “have it all” while making things easier.
Key features:
- seamless WooCommerce integration;
- takes product data dynamically from inventory;
- supports WordPress Block editor;
- customizable column layouts;
- ability to output all product details and product variations;
- JetSmartFilters compatibility for advanced filtering;
- responsive layouts for mobile users;
- support for action buttons;
- vertical and horizontal table layouts for desktop users;
- basic search, filter, and sorting options (date, name, product ID, etc.);
- style settings for product tables.
Pricing: the single plugin costs $43/year. It is also available in the Crocoblock subscription, starting at $199/year for one project.
Pros:
- handles large inventories;
- real-time data updates;
- supports bulk orders and detailed product comparisons for B2B needs;
- ability to create table presets and generate shortcodes in the UI;
- 30-day refund policy.
WP Table Builder (Freemium)
🏆 Best for building creative table layouts in a drag-and-drop interface.
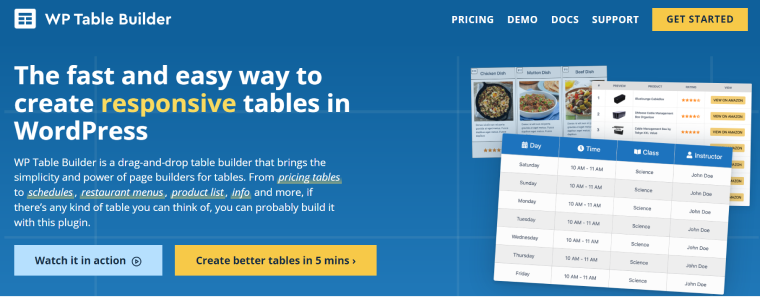
WP Table Builder is like a Swiss Army knife for tables. Need a simple comparison chart for blog readers? Done. Want to design a flashy pricing table featuring images, buttons, and custom icons? No problem. Its drag-and-drop interface makes it as easy as stacking Lego bricks – all without coding.
But that’s not all. WP Table Builder supports various table creation, from feature comparisons and product grids to detailed data tables. Throw in the ability to add text, media, and even shortcodes, and you have a great plugin for table customization.
Key features:
- drag-and-drop interface;
- supports images, text, buttons, and custom elements;
- pre-designed templates for quick setups;
- column/row merging for creative layouts;
- ability to make tables responsive.
Pricing: free. Premium plans start at $59/year.
Pros:
- super easy to use, even for beginners;
- highly customizable for unique layouts;
- works great with Gutenberg and other editors;
- ideal for affiliate marketers.
Ninja Tables (Freemium)
🏆 Best for best for handling large datasets using advanced customization options.

Ninja Tables is here to handle large datasets. It’s not just about showing data—it’s about making it actionable. From WooCommerce product lists to travel package comparisons, this plugin brings structure and speed to even the most complex tables.
What truly sets Ninja Tables apart is its robust integration capabilities. You can seamlessly sync data with Google Sheets, enabling real-time updates to your tables as your source data changes. Additionally, it offers compatibility with popular WordPress tools and third-party services, ensuring smooth workflows for even the most complex projects. For eCommerce stores, it integrates with WooCommerce, allowing you to pull and display product attributes dynamically.
Key features:
- handles large datasets without lag;
- Google Sheets integration for real-time updates;
- WooCommerce-ready;
- conditional formatting for styling;
- advanced filtering and sorting tools.
Pricing: a free version is available; Premium plans start at $79/year.
Pros:
- built for speed;
- rich customization for data presentation;
- 14-day money-back guarantee;
- integrates with Google Sheets, Fluent Forms, WooCommerce, and Ninja Charts.
TablePress (Freemium)
🏆 Best for creating clean, functional tables with minimal effort.

TablePress makes creating tables in WordPress a breeze. With its spreadsheet-style interface, you can easily input data or import it from Excel, CSV, HTML, or JSON files. Tables can be added anywhere on your site using shortcodes, and features like sorting, pagination, and filtering keep everything user-friendly.
For those who like a bit more control, TablePress supports formulas and custom HTML, making it flexible enough for advanced use cases.
Key features:
- import/export support for CSV and Excel files;
- formulas for calculations;
- sortable columns and pagination;
- shortcodes for easy embedding;
Pricing: a free version is available; Premium plans start at $89/year.
Pros:
- easy to learn and use;
- perfect for static data tables;
- ideal for schools, researchers, and analysts.
Easy Pricing Tables (Freemium)
🏆 Best for SaaS and service providers who want conversion-focused pricing tables.

The Easy Pricing Tables plugin makes creating pricing grids effortless. With features like a drag-and-drop editor, customizable highlights for top plans, and responsive design, your tables are likely to look great and drive sales. You can tweak colors, fonts, and layouts to match your brand, all while keeping the focus on converting visitors into customers.
Key features:
- conversion-optimized pricing templates;
- responsive layouts for all devices;
- customizable fonts, colors, and icons;
- built-in CTA buttons to drive action;
- compatible with Gutenberg and Elementor.
Pricing: a free version is available; Premium plans start at $49/year.
Pros:
- easy to match with your site’s branding;
- perfect for SaaS and subscription-based businesses;
- lightweight and fast;
- 60-day money-back guarantee.
FAQ
Comparison tables make it easier for users to analyze and compare multiple options side-by-side, helping them identify key differences and choose the best fit for their needs.
Yes, many tools will help you build professional-looking comparison tables without any coding skills. These WordPress comparison table plugins typically provide user-friendly interfaces and customizable templates.
Absolutely. Whether it’s a blog, eCommerce store, or SaaS platform, comparison tables enhance usability by simplifying complex data and making key differences visually clear.
Conclusion
A well-designed comparison table can be a game-changer for your website, helping users make informed decisions while enhancing their overall experience. Whether you’re comparing products, features, pricing, or technical specifications, the key is to choose the right plugin that suits your needs. Here’s a quick recap of the top plugins from this list:
- JetProductTables is best for WooCommerce stores seeking dynamic, user-friendly product tables;
- WP Table Builder – best for building creative table layouts in a drag-and-drop interface;
- Ninja Tables – best for handling large datasets using advanced customization options;
- TablePress is best for creating clean, functional tables with minimal effort;
- Easy Pricing Tables — best for building conversion-focused pricing comparison tables.
