Do you need to add dynamics to the statistics showcase? The dynamic chart is an effective solution for highly dynamic websites. In this article, I will explore various methods for creating and dynamically building charts using coding and graph plugins in WordPress, including the most commonly used chart plugins among WordPress users. Additionally, I will analyze what makes a chart interactive and dynamic, and what you should consider when choosing a solution that best suits your needs.
What Makes a Chart Dynamic and Interactive
A dynamic chart is a type of chart that automatically updates its data and visual representation in response to changes in the underlying data source. In contrast to static charts, dynamic charts can retrieve data in real time from databases, APIs, or custom fields, automatically displaying the most current information.
A chart is considered dynamic when its data changes automatically without requiring manual updates to the chart:
- the real-time data is fetched from a database, JSON file, or WordPress custom fields;
- updates automatically when the underlying data changes.
📚 Read also: Elementor Charts: How to Create Static and Dynamic Charts?
Top Methods to Create Dynamic Charts and Graphs in WordPress
So, let’s investigate the top ways to build dynamic charts – from custom code to the best WordPress chart plugin alternatives.
Creating dynamic charts using the code
This method uses several types of codes, offering flexibility beyond the flowchart plugin WordPress typically provides. The method expects you to have a basic understanding of coding. Additionally, I would like to mention that the offered codes are fundamental, enabling you to expand the chart’s functionality or styles to meet your specific needs.
Step 1: first, proceed to the page where you need to display the flow chart, much like you would with a WordPress flowchart plugin, and add the HTML widget if you work in Elementor, or the Custom HTML block in Gutenberg. Add the following code to it and save it for now:
<div class="chart-wrap">
    <canvas id="chart"></canvas>
    <div id="tooltip" class="tooltip" style="display:none"></div>
</div>Step 2: the following CSS code should be added to Appearance > Customize > Additional CSS or your child theme style.css:
.chart-wrap {
  position: relative;
  width: 100%;
  max-width: 800px;
  margin: 40px auto;
}
canvas {
  width: 100%;
  height: 400px;
  display: block;
}
.tooltip {
  position: absolute;
  pointer-events: none;
  background: rgba(0,0,0,0.8);
  color: #fff;
  padding: 6px 8px;
  border-radius: 4px;
  font-size: 13px;
  transform: translate(-50%, -120%);
  white-space: nowrap;
}
Don’t forget to save the changes.
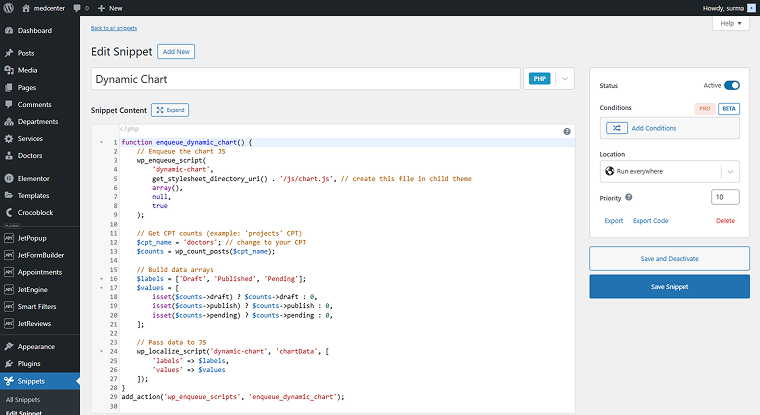
Step 3: now, we need to enqueue the JS code and pass the Custom Post Type data.
Add the following code either to your child theme’s functions.php or to the Code Snippets or similar plugin:
function enqueue_dynamic_chart() {
    // Enqueue the chart JS
    wp_enqueue_script(
        'dynamic-chart',
        get_stylesheet_directory_uri() . '/js/chart.js', // create this file in child theme
        array(),
        null,
        true
    );
    // Get CPT counts (example: 'projects' CPT)
    $cpt_name = 'projects'; // change to your CPT
    $counts = wp_count_posts($cpt_name);
    // Build data arrays
    $labels = ['Draft', 'Published', 'Pending'];
    $values = [
        isset($counts->draft) ? $counts->draft : 0,
        isset($counts->publish) ? $counts->publish : 0,
        isset($counts->pending) ? $counts->pending : 0,
    ];
    // Pass data to JS
    wp_localize_script('dynamic-chart', 'chartData', [
        'labels' => $labels,
        'values' => $values
    ]);
}
add_action('wp_enqueue_scripts', 'enqueue_dynamic_chart');
Ensure that you use the name of your CPT instead of the “projects.” You can add more labels/statuses if needed.
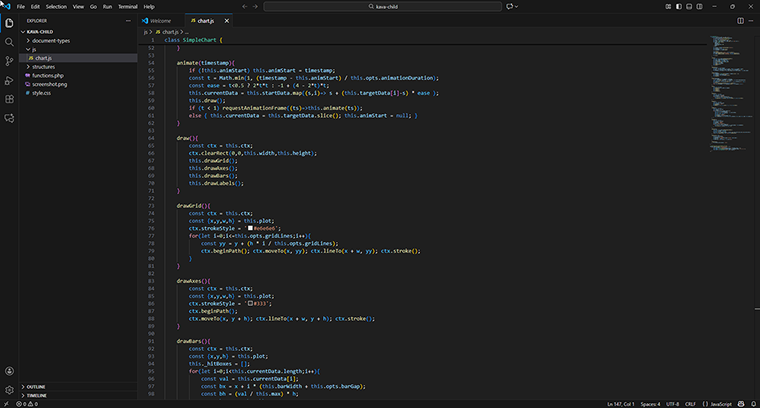
Step 4: now, proceed to the JS folder of your site’s child theme. If you don’t have it, that’s fine; you can easily create it.
Open the child theme folder in a code editor of your choice, such as VS Code, Sublime, or Notepad++. Inside this folder, create another one named “JS.” And inside the “JS” folder, create a new file and name it “chart.js.”
So, we proceed to the wp-content/themes/your-child-theme/js/chart.js folder and paste the full JS code below as-is:
class SimpleChart {
    constructor(canvasId, data = [], opts = {}) {
        this.canvas = document.getElementById(canvasId);
        if (!this.canvas) return; // safety check
        this.ctx = this.canvas.getContext('2d');
        this.data = Array.isArray(data) ? data : [1];
        this.labels = opts.labels || this.data.map((_,i)=>`Item ${i+1}`);
        this.opts = Object.assign({
            padding: 50,
            gridLines: 5,
            animationDuration: 600,
            barGap: 12
        }, opts);
        this.tooltip = document.getElementById('tooltip');
        this.animStart = null;
        this.currentData = this.data.slice();
        this.targetData = this.data.slice();
        this.resize();
        window.addEventListener('resize', ()=>this.resize());
        this.canvas.addEventListener('mousemove', (e)=>this.onPointer(e));
        this.canvas.addEventListener('mouseleave', ()=>this.hideTooltip());
        this.draw();
    }
    resize(){
        const rect = this.canvas.getBoundingClientRect();
        const dpr = window.devicePixelRatio || 1;
        this.canvas.width = rect.width * dpr;
        this.canvas.height = rect.height * dpr;
        this.ctx.setTransform(dpr,0,0,dpr,0,0);
        this.width = rect.width;
        this.height = rect.height;
        this.computeScale();
        this.draw();
    }
    computeScale(){
        const pad = this.opts.padding;
        this.plot = {x: pad, y: pad, w: this.width - pad*2, h: this.height - pad*2};
        this.max = this.targetData.length ? Math.max(...this.targetData, 1) : 1;
        this.barWidth = (this.plot.w - (this.data.length-1)*this.opts.barGap) / this.data.length;
    }
    setData(newData){
        this.targetData = Array.isArray(newData) ? newData.slice() : [1];
        this.animStart = performance.now();
        this.startData = this.currentData.slice();
        this.animate();
    }
    animate(timestamp){
        if (!this.animStart) this.animStart = timestamp;
        const t = Math.min(1, (timestamp - this.animStart) / this.opts.animationDuration);
        const ease = t<0.5 ? 2*t*t : -1 + (4 - 2*t)*t;
        this.currentData = this.startData.map((s,i)=> s + (this.targetData[i]-s) * ease );
        this.draw();
        if (t < 1) requestAnimationFrame((ts)=>this.animate(ts));
        else { this.currentData = this.targetData.slice(); this.animStart = null; }
    }
    draw(){
        const ctx = this.ctx;
        ctx.clearRect(0,0,this.width,this.height);
        this.drawGrid();
        this.drawAxes();
        this.drawBars();
        this.drawLabels();
    }
    drawGrid(){
        const ctx = this.ctx;
        const {x,y,w,h} = this.plot;
        ctx.strokeStyle = '#e6e6e6';
        for(let i=0;i<=this.opts.gridLines;i++){
            const yy = y + (h * i / this.opts.gridLines);
            ctx.beginPath(); ctx.moveTo(x, yy); ctx.lineTo(x + w, yy); ctx.stroke();
        }
    }
    drawAxes(){
        const ctx = this.ctx;
        const {x,y,w,h} = this.plot;
        ctx.strokeStyle = '#333';
        ctx.beginPath();
        ctx.moveTo(x, y + h); ctx.lineTo(x + w, y + h); ctx.stroke();
    }
    drawBars(){
        const ctx = this.ctx;
        const {x,y,h} = this.plot;
        this._hitBoxes = [];
        for(let i=0;i<this.currentData.length;i++){
            const val = this.currentData[i];
            const bx = x + i * (this.barWidth + this.opts.barGap);
            const bh = (val / this.max) * h;
            const by = y + h - bh;
            ctx.fillStyle = '#4a90e2';
            ctx.fillRect(bx, by, this.barWidth, bh);
            this._hitBoxes[i] = {x: bx, y: by, w: this.barWidth, h: bh, value: val, label: this.labels[i]};
        }
    }
    drawLabels(){
        const ctx = this.ctx;
        const {x,y,h} = this.plot;
        ctx.fillStyle = '#333';
        ctx.textAlign = 'center';
        ctx.font = '12px sans-serif';
        for(let i=0;i<this.labels.length;i++){
            const bx = x + i * (this.barWidth + this.opts.barGap) + this.barWidth/2;
            ctx.fillText(this.labels[i], bx, y+h + 16);
        }
    }
    onPointer(e){
        const rect = this.canvas.getBoundingClientRect();
        const px = e.clientX - rect.left;
        const py = e.clientY - rect.top;
        const hit = this._hitBoxes.find(hb => px>=hb.x && px<=hb.x+hb.w && py>=hb.y && py<=hb.y+hb.h);
        if(hit) this.showTooltip(px, hit); else this.hideTooltip();
    }
    showTooltip(x, hit){
        const tt = this.tooltip;
        tt.style.display = 'block';
        tt.innerHTML = `<strong>${hit.label}</strong>: ${hit.value}`;
        tt.style.left = `${x}px`;
        tt.style.top = `${this.plot.y + this.plot.h}px`;
    }
    hideTooltip(){
        this.tooltip.style.display = 'none';
    }
}
// Initialize chart with WordPress CPT data
document.addEventListener('DOMContentLoaded', ()=>{
    if (typeof chartData !== 'undefined') {
        const data = Array.isArray(chartData.values) ? chartData.values : [1];
        const labels = Array.isArray(chartData.labels) ? chartData.labels : ['A','B','C'];
        const chart = new SimpleChart('chart', data, {labels});
    }
});
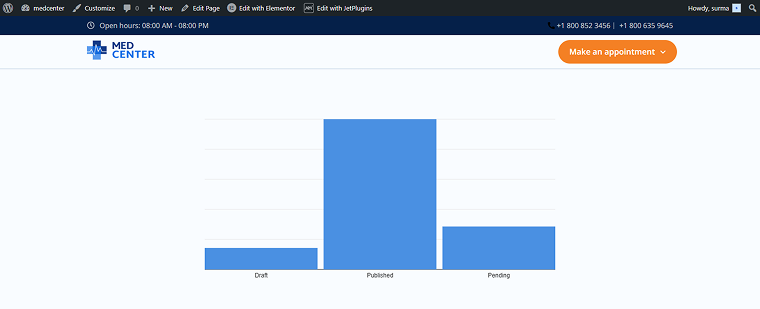
I know, that’s a lot, but that was the last step! Now, let’s open the front-end page where we added the very first code. Here, we see the chart showing the statistics of posts published, pending, and in draft.
Building charts with CanvasJS
Now, let’s investigate another method involving coding. This solution is slightly shorter and less complicated than the previous one, yet still enables us to build a dynamic graph similar to what a WordPress graph plugin would provide.
Step 1: move to the page where you want the flowchart, then add the HTML widget in Elementor or a Custom HTML block in Gutenberg. Add the following code to the element:
<div id="canvasjsChartContainer" style="height: 400px; width: 100%;"></div>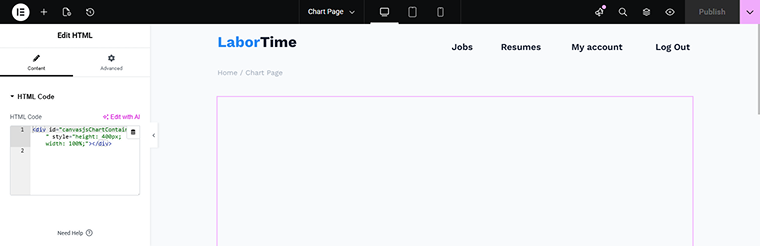
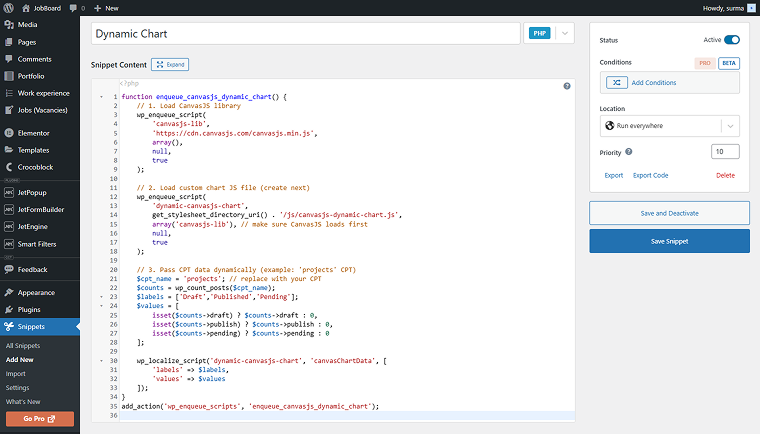
Step 2: in your child theme’s functions.php or Code Snippets, or similar plugin, paste the following code:
function enqueue_canvasjs_dynamic_chart() {
    // 1. Load CanvasJS library
    wp_enqueue_script(
        'canvasjs-lib',
        'https://cdn.canvasjs.com/canvasjs.min.js',
        array(),
        null,
        true
    );
// 2. Load custom chart JS file (create next)
    wp_enqueue_script(
        'dynamic-canvasjs-chart',
        get_stylesheet_directory_uri() . '/js/canvasjs-dynamic-chart.js',
        array('canvasjs-lib'), // make sure CanvasJS loads first
        null,
        true
    );
// 3. Pass CPT data dynamically (example: 'projects' CPT)
    $cpt_name = 'projects'; // replace with your CPT
    $counts = wp_count_posts($cpt_name);
    $labels = ['Draft','Published','Pending'];
    $values = [
        isset($counts->draft) ? $counts->draft : 0,
        isset($counts->publish) ? $counts->publish : 0,
        isset($counts->pending) ? $counts->pending : 0
    ];
wp_localize_script('dynamic-canvasjs-chart', 'canvasChartData', [
        'labels' => $labels,
        'values' => $values
    ]);
}
add_action('wp_enqueue_scripts', 'enqueue_canvasjs_dynamic_chart');
Save the snippet.
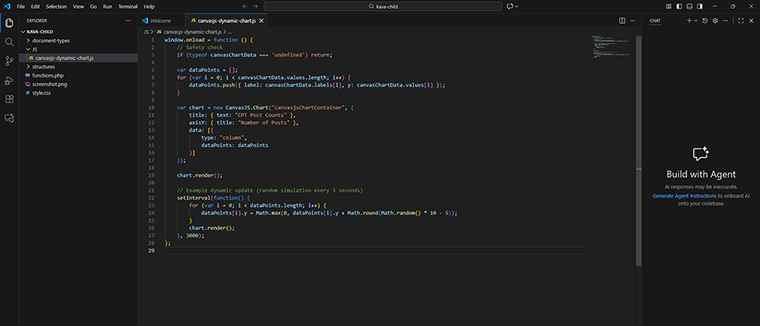
Step 3: in your child theme folder, proceed to or create the /js/canvasjs-dynamic-chart.js folder.
If you don’t have the JS folder created, use your preferred code editor (such as VS Code, Sublime, or Notepad++) to open the child theme folder. Within this folder, establish a new directory named “JS,” and inside that “JS” directory, create a file called “chart.js.”
Paste the following code:
window.onload = function () {
 	// Safety check
 	if (typeof canvasChartData === 'undefined') return;
var dataPoints = [];
 	for (var i = 0; i < canvasChartData.values.length; i++) {
     	dataPoints.push({ label: canvasChartData.labels[i], y: canvasChartData.values[i] });
 	}
var chart = new CanvasJS.Chart("canvasjsChartContainer", {
     	title: { text: "CPT Post Counts" },
     	axisY: { title: "Number of Posts" },
     	data: [{
         	type: "column",
         	dataPoints: dataPoints
     	}]
 	});
chart.render();
// Example dynamic update (random simulation every 3 seconds)
 	setInterval(function() {
     	for (var i = 0; i < dataPoints.length; i++) {
         	dataPoints[i].y = Math.max(0, dataPoints[i].y + Math.round(Math.random() * 10 - 5));
     	}
     	chart.render();
 	}, 3000);
 };
The set interval block is not mandatory; its purpose is to replicate live updates in a controlled manner. This can be substituted with real-time data retrieved via AJAX or REST API calls.
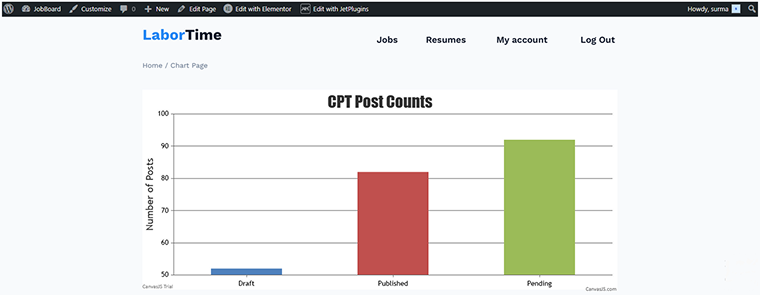
That’s it, now, let’s check the front-end page. Here we see the statistics dynamically update:
Adding charts with JetElements widgets
Now, let’s focus on the methods that don’t require coding. The JetElements plugin offers a range of chart widgets that function similarly to an Elementor chart plugin WordPress users would add for quick visualizations. But as you can learn from our article on the charts, they are static. But let’s see how we can make them dynamic!
I will use the Bar Chart widget as an example. So, add it to the page. Decide whether you want the vertical or horizontal bar type and set the labels. Move to the Use JetEngine Query toggle and enable it.
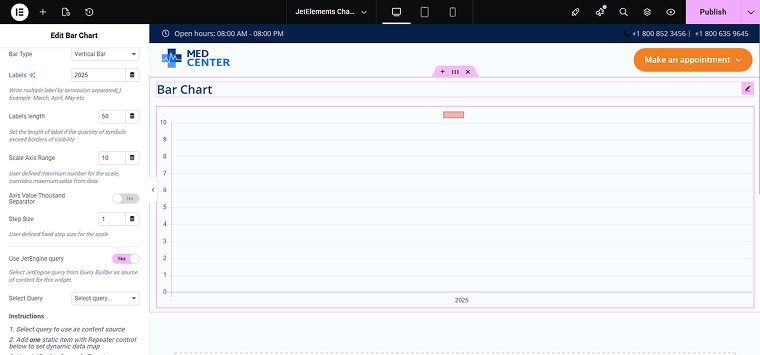
We need the custom query prepared. In this case, I use the Posts Query to return the most popular services.
Select the required query in the Bar Chart widget settings and set one item. I used the Custom Fields for the label (“post_title”) and data (“rating_number”).
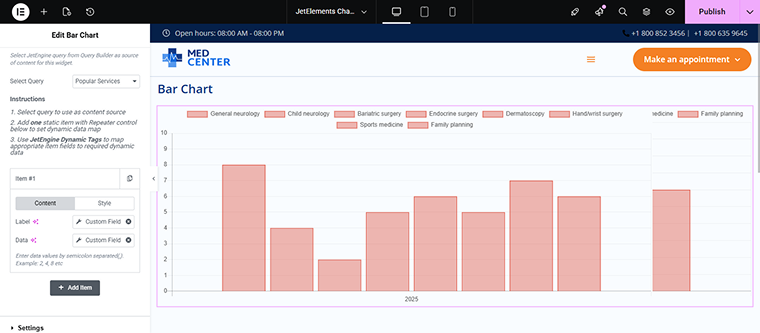
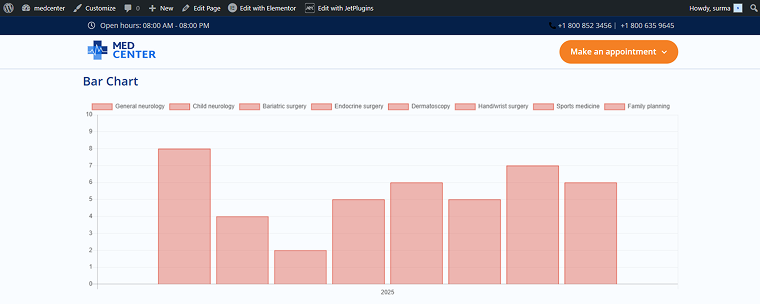
As a result, we can view the statistics on the post service rating in 2025. When the rating numbers are changed, modifications are displayed in the flow chart on the WordPress front-end pages.
Using JetEngine’s Dynamic Charts Builder
Let’s proceed to the best chart plugin for WordPress, in my humble opinion. It doesn’t involve any coding and is more customizable and functional than JetElements’ widgets, making it a strong alternative to any WordPress plugin, chart, or graph solution. Obviously, I’m talking about the JetEngine’s Dynamic Charts Builder.
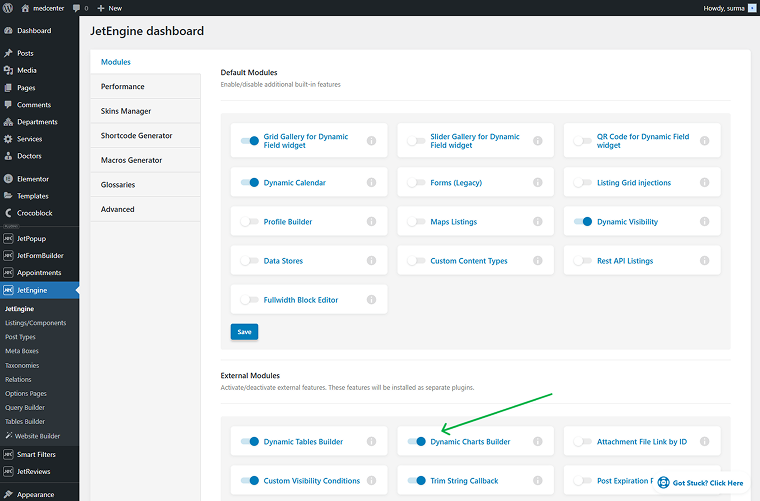
Let’s look through the dynamic chart setup process. First of all, the module should be activated. For that, proceed to WordPress Dashboard > JetEngine > JetEngine > Modules > External Modules and toggle on the Dynamic Charts Builder.
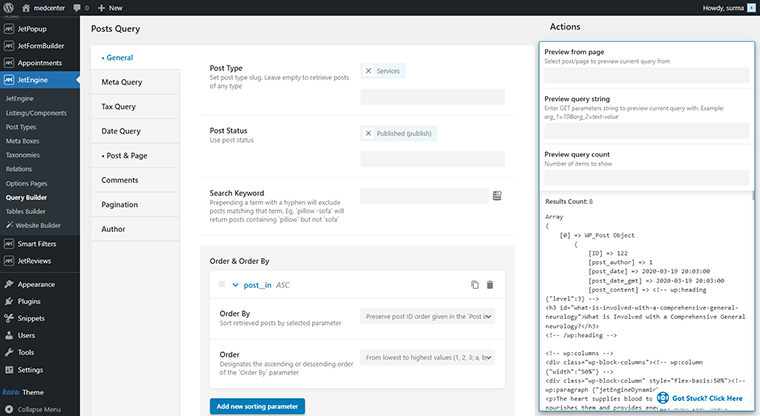
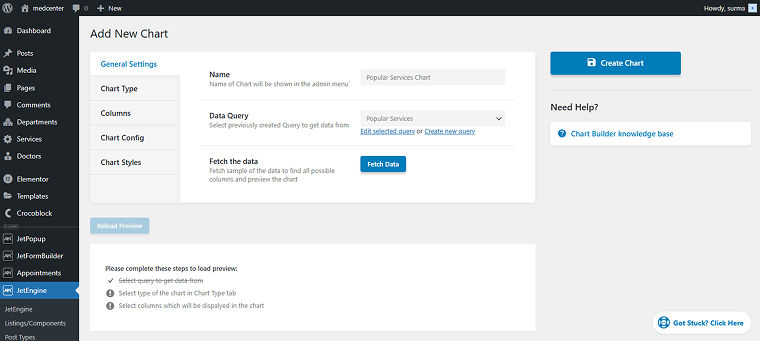
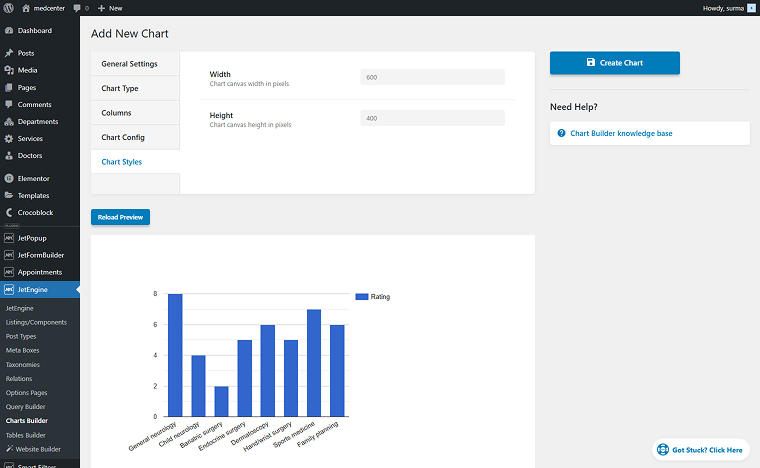
Then, move to the Dynamic Charts Builder page and add a new one. In the General Settings tab, you can set the name for the Chart and the Custom Query from which we get the data.
In the Chart Type tab, select the desired type of dynamic chart. Among the options, the following types are available, covering many use cases normally handled by a WordPress plugin organization chart:
- Bar;
- Line;
- Area;
- Pie;
- Donut;
- Bubble;
- Stepped Area;
- Candlestick;
- Histogram;
- Columns;
- Scatter;
- Geo.

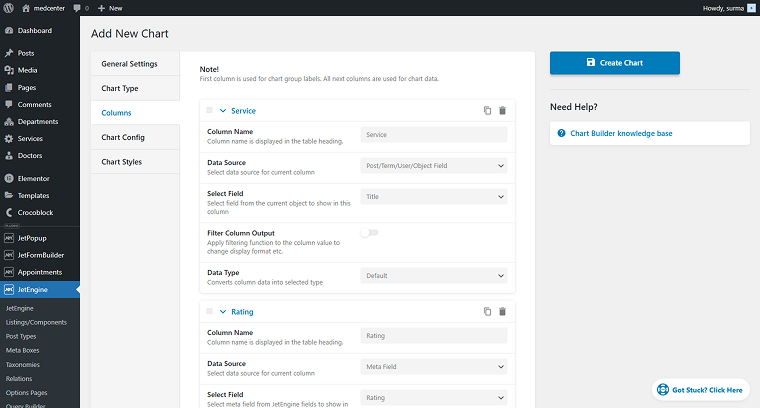
The next essential step is column settings. Here, we choose which data to display. For example, I need to showcase post titles and the rating number.
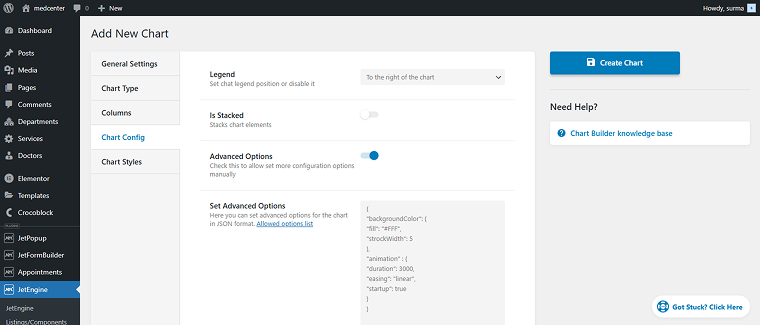
In the Chart Config section, you can customize the appearance and behavior of the chart, including options for the legend position, stacking, and advanced settings through JSON for detailed adjustments.
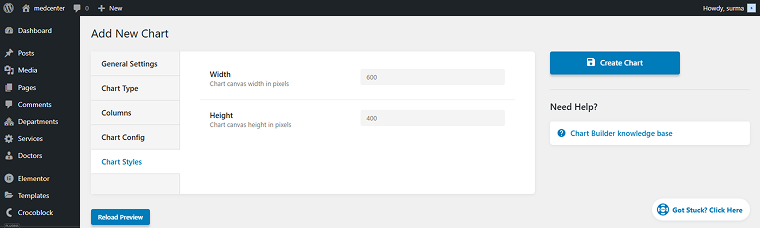
In the Chart Styles tab, you can adjust the width and set the height for the chart in pixels.
Once the main data is set, you can preview the chart and make any necessary modifications.
Save the settings and proceed to the page where you need to display the chart, as an Elementor chart plugin does. Add the Dynamic Chart widget and select the chart you created.
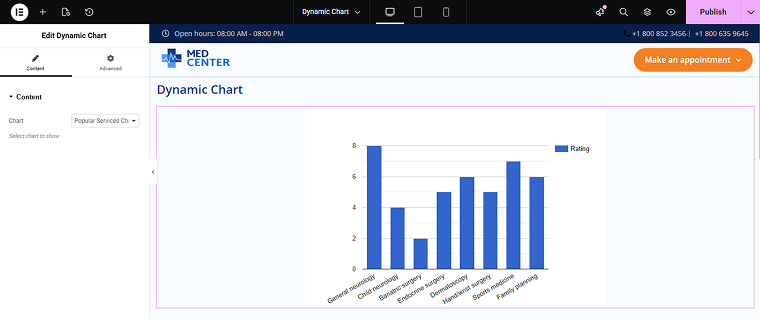
Publish the changes, and on the front end, you can see a dynamic chart displaying statistics for the service posts on my WordPress site.

Which Method to Choose
To determine the best approach to creating and presenting dynamic charts in WordPress, consider a few practical elements. Your selection will depend on your required technical adaptability, the extent of customization you need, your anticipated performance, and the degree of integration necessary between your charts, JetEngine, and dynamic WordPress content. Let’s have a look at the primary points for consideration:
- Type of data source – different methods support different levels of data complexity. Choose based on whether your dataset is manual or generated from CPTs, relationships, repeating fields, JetEngine queries, or external data sources.
- Level of customization – each method offers a different level of control, so select based on whether you want full design control or a plug-and-play chart UI.
- Skill level required – your technical comfort plays a major role. Choose based on your comfort level working with JavaScript and WordPress theme files, or using a flowchart plugin that WordPress beginners prefer.
- Dynamic updates and interactivity – different chart types offer different levels of live-updating, so select the method based on your need for real-time animation or simple static charts.
- Performance – complexity affects load time. Choose according to the number of charts per page and overall site performance.
FAQ
A static chart always displays the same data unless you manually update the code or content on the backend – even when using a WordPress flowchart plugin.
A dynamic chart updates automatically based on real-time or database-driven values – for example, pulling numbers from a CPT field, form submission, WooCommerce sales, or API results.
The primary advantage of using a dynamic chart is that it updates automatically whenever the underlying data changes, ensuring you always display accurate, real-time information without having to manually edit the chart.
Dynamic charts are especially useful when your data comes from Custom Post Types (CPTs), WooCommerce sales, form submissions, JetEngine queries, external APIs, and any frequently changing database values.
Not necessarily. HTML/JS Canvas and CanvasJS require basic to intermediate coding skills.
JetElements charts and JetEngine Dynamic Charts Builder enable you to build charts through intuitive UI settings, eliminating the need for coding.
Final Thoughts
After reading this article, you will know at least four methods of building and displaying dynamic charts in WordPress in various environments. Now, you understand the difference between static and dynamic flowcharts and how to select the most appropriate solution for your particular case. To sum up, let’s consider the following:
- JetEngine Dynamic Charts Builder is the most dynamic solution. CanvasJS codes require manual setup of the data source.
- CanvasJS codes allow us the widest range of customization options, with no limits. JetEngine Dynamic Charts Builder is second in terms of customization – it is quite customizable, but a bit more limited than CanvasJS or a dedicated WordPress plugin for an organization chart.
- In terms of skills required, the simplest approach is the JetElements’ widgets. JetEngine Dynamic Charts Builder is also not a too complicated solution. Of course, CanvasJS codes require a high level of skill.


